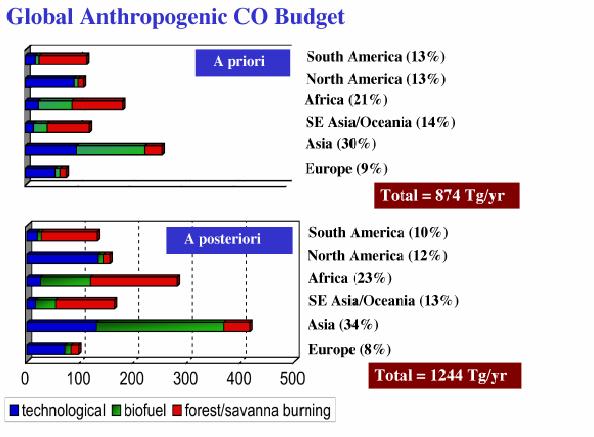
Figure 2: Anthropogenic
CO emissions by different sources and geographical regions from
previous inventory estimates,
a priori and after performing
a linearized Kalman filter inversion of the MOPITT CO data at 700 hPa in
conjunction
with the MOZART-2
chemical transport model, a posteriori