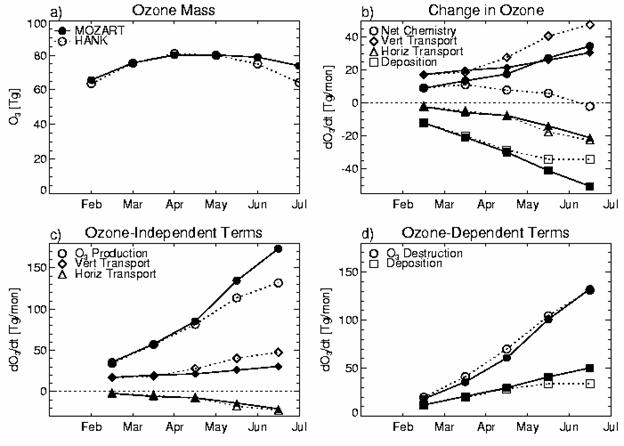
Figure 3: This
figure shows the ozone budget of MOZART and HANK for the northern middle
and high latitudes
(30°-90°N, surface to 350 hPa). (a)
total O3 mass for first day of each month; (b) monthly rates of
change in
ozone mass, due to chemistry, horizontal (northward) and vertical
(downward) transport and deposition;
(c) contributions to ozone sources: chemical
production and net transport; and (d) contributions to ozone sinks:
chemical
destruction and deposition.