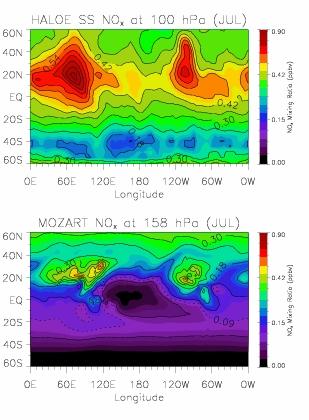
Figure
7: Spatial
structure of climatological NOx in
July, derived from HALOE satellite measurements at 100 hPa (left),
and from
a MOZART3 simulation at 158 hPa (right). The HALOE data are a sum of the sunset
measurements of NO and NO2,
while the MOZART3 results show a full
diurnal average. Note the relative maxima over the South Asian and North American
summer monsoon regions, probably due to lightning generation of NOx.