
Stratospheric Temperature Trends
Temperature changes in the stratosphere are an important component of global change, and are closely linked to understanding the behavior of stratospheric ozone. ACD scientists helped organize an updated assessment of stratospheric temperature trends, based on analysis of historical radiosonde (balloon), satellite and lidar measurements. This work was performed over the last several years in collaboration with a group organized under the WCRP SPARC (Stratospheric Processes And their Role in Climate) Program. Radiosonde measurements cover altitudes up to approximately 27 km, with reasonable global coverage of the stratosphere since the late 1960’s. Satellite measurements of stratospheric temperature are available from the series of NOAA operational instruments beginning in 1979, including the Microwave Sounding Unit (MSU) and the Stratospheric Sounding Unit (SSU). Constructing time series of satellite data requires combining results from 13 separate operational satellites since 1979, and is a complex problem because of differences in instrument calibration, drifting and decaying satellite orbits, and other details. Radiosonde data are also plagued by changes in instrumentation and observational practices that hamper the detection of small climate-related changes. Our analyses compared results for six different radiosonde data sets, incorporating a variety of homogeneity adjustments to account for such artificial changes.
Results
Time series of stratospheric temperature anomalies from satellite data (Fig. 1) show overall cooling during 1979-2005. The time series are punctuated by transient warming events associated with the large volcanic eruptions of El Chichon (1982) and Mt. Pinatubo (1991), which persist for approximately two years. The overall cooling ranges from ~-0.5 K/decade in the lower stratosphere (~20 km), to over -1K/decade in the upper stratosphere (40-50 km). These values can be compared with warming in the lower atmosphere (troposphere) over the same period of order 0.1-0.2 K/decade. The time series in Fig. 1 show that the stratospheric changes are not monotonic, but more step-like in nature; note that stratospheric temperatures have been relatively constant over the recent decade 1995-2005.
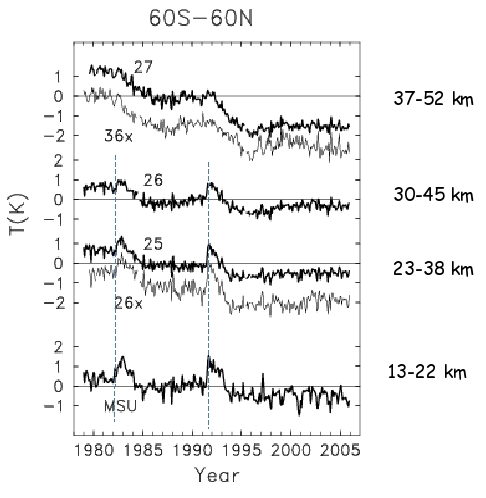
Figure 1:
Time series of near global mean stratospheric temperature anomalies derived from satellite observations. Each curve shows results from separate instrument channels, which correspond to different altitudes in the stratosphere. Results are shown for MSU channel 4 (lower curve), and a series of SSU channels covering the middle to upper stratosphere. Dashed lines denote the timing of the volcanic eruptions of El Chichon (1982) and Mt. Pinatubo (1991).
The vertical profile of global average stratospheric temperature trends during 1979-2005, including both satellite and radiosonde results (Fig. 2), shows the overall increase of cooling with altitude. Model calculations have shown that this cooling results from the combined influence of increasing atmospheric CO2 and decreasing stratospheric ozone. Note there is reasonably good agreement between trends calculated from the (independent) satellite and radiosonde data in the lower stratosphere.
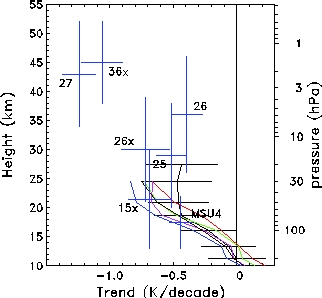
Figure 2:
Vertical profile of near-global (60° N-S) stratospheric temperature trends for 1979-2005 derived from satellite and radiosonde measurements. Blue crosses denote results derived from MSU and SSU satellite data, with the vertical bars denoting the approximate altitudes covered by separate instrument channels. Colored curves show trends derived from different radiosonde data sets up to ~25 km. Horizontal bars denote 2-sigma statistical trend uncertainties.
These updated analyses will be utilized for detailed comparisons to community model results within the SPARC Chemistry Climate Model validation (CCMval) Project.
References
Randel, W.J., and coauthors, 2009: An update of observed stratospheric temperature trends. J. Geophys. Res., 114, D02107, doi:10.1029/2008JD01042. pdf reprint