The
Atmospheric Chemistry Division
|
The
Atmospheric Chemistry Division
|
DIVISION NARRATIVE
Atmospheric Odd Nitrogen Group
The Atmospheric Odd Nitrogen (AON) Group's (Brian Ridley, Frank Flocke, Andrew Weinheimer, Denise Montzka, David Knapp, and Frank Grahek) expertise is in measurements and analysis of NO, NO2, total reactive nitrogen (NOy), O3, peroxyacetyl nitrate (PAN) and related homologues, and other organic nitrates. This past year the group focused on NO-NOy instrument development, analysis of Cirrus Regional Study of Tropical Anvils and Cirrus Layers - Florida Area Cirrus Experiment (CRYSTAL-FACE) results, kinetics of alkyl nitrates, refined characterization of the fast PAN- Gas Chromatography (GC), and characterization of a novel Thermal Dissociation - Chemical Ionization Mass Spectrometer (TD-CIMS) for PANs.
PAN, PPN, PiBN and MPAN were measured on board the NASA P-3B aircraft during the TRACE-P mission (February to April, 2001) with 20 flights spanning a longitude range of 100 to 300 °E and a latitude range of 10 to 40° N. Local flights were based out of Hong Kong (4) and Yokota Air Base, Japan (5) as well as one night flight out of Midway Islands. PAN mixing ratios ranged from below the limit of detection in the Pacific marine boundary layer to almost 3 ppbv, observed near Tokyo and in the Shanghai urban plume. Strongly elevated mixing ratios of PANs were also observed over the Sea of Japan, the Yellow Sea and the East and South China Seas, associated with continental outflow from Asia. Elevated PAN was also observed far removed from the continent over the central and Eastern Pacific Ocean, when pollution plumes originating from Asia were encountered. The observed ratios of different PAN species were generally consistent with anthropogenic pollution rather than biogenic sources.
The export of PANs from polluted regions is generally viewed as a means of transporting NOx to remote regions where it may impact the chemistry of ozone upon subsidence of an air mass. Indeed, profiles of PAN and NOx observed over the central Pacific by the P3 in TRACE-P suggest that the descent of air parcels and the attendant warming may foster the conversion of PAN to NOx. The median vertical profiles of PAN and NOx for three longitude bins (Asia/Western Pacific, Central Pacific and Eastern Pacific) were simulated in box models runs with imposed density and temperature time series to simulate descent. Also simulated was the impact of the NOx so liberated on the profile of O3.
AON Figure 1a (upper panel) shows a comparison of the measured profiles of PAN, NOx, and ozone with those obtained by modeling the descent of an air parcel from 6 km that is initialized with median measured values and which descends at 1.2 km/day through the observed temperature profile. As the air parcel descends in the model, PAN dissociates at an increasing rate, resulting in a release of NOx, which becomes available to affect ozone chemistry. The ozone profile, however, shows little variation, in both the model and the observations. The lower panel (AON Figure 1b) illustrates the effect of the initial mixing ratio of PAN on ozone. The sensitivity of low-level O3 to initial PAN at 6 km, prior to descent of the air parcel, is about 1 ppbv O3 per 100 pptv PAN. The median value at 6 km for 160-200°E is 200 pptv, so the effect of PAN is to counteract the net destruction that occurs during descent by an amount of 2 ppbv. The upper panel of Figure 1 also shows two model runs with the measured aldehyde mixing ratios and with the aldehydes set to zero. The measured aldehyde mixing ratios of about 150 pptv for acetaldehyde and 75 pptv for propionaldehyde do not agree with the observations of PANs and NOx over the remote Pacific Ocean. Such high aldehyde mixing ratios would remove all NOx in a period of less than a day and convert it back to PAN. Similar circumstances were observed in the Arctic boundary layer during TOPSE. Ambient measurements of aldehydes in remote areas must be reevaluated with respect to inlet artifacts or other interferences.
AON Figure 1a (upper panel): A comparison of the measured profiles of PAN, NOx, and ozone with those obtained by modeling. 1b (lower panel): The effect of the initial mixing ratio of PAN on ozone.
In an attempt to improve instrument performance, and with an eye toward the development of a new, two-channel instrument for the HIAPER aircraft, the group performed laboratory tests of photomultiplier tubes and reaction vessel design. In addition, computer simulations of photon collection were conducted to guide potential reaction vessel modifications. For the new HIAPER instrument, a computer for data acquisition and instrument control was purchased and was interfaced with some components. Work was started on the design of the mechanical layout of the new HIAPER instrument in order to fit into the new aircraft. In a related effort, the group provided instrument design specifications to Purdue University (Paul Shepson, Kimberley Hill) to facilitate their measurement capabilities for NO and NOy.
A goal of CRYSTAL-FACE was to measure the condensed-phase amounts of HNO3 and NOy on ice and other particles. On the WB-57, the NCAR NOy and the NOAA (David Fahey, Ru-Shan Gao, Peter Popp, Tim Marcy) HNO3 instruments were each equipped with similar pairs of inlets so that each would have a forward-facing inlet to collect particles in an enhanced manner (enhancing the particle signal relative to that from the gas phase), plus a second inlet to collect primarily gas-phase species only. The measurements of condensed-phase NOy and condensed-phase HNO3 were generally in agreement with each other, with a couple of interesting exceptions. However, there was no compelling evidence for the presence of significant amounts of condensed-phase NOy species other than HNO3. Overall the measured condensed-phase HNO3 is reasonably well fit with a Langmuir adsorption model and is generally much greater than that which could be explained by dissolution in the solid. Alternatively, the condensed-phase amounts may be calculated using a multi-layer adsorption model, with the measured adsorption being 10-100% of that calculated. The fraction of total HNO3 found in the condensed phase varied with the ice particle surface area with small (<10%) amounts for low surface areas up to 100% for large surface areas.
The difference in the condensed-phase signals from the HNO3 and NOy instruments and the greater sensitivity of the HNO3 instrument to particles smaller than 4 microns suggests the possible presence of HNO3-containing aerosols on one flight, during which the obesrved aerosols competed effectively with ice for the uptake of HNO3. On another flight, an interesting exception to the model-predicted temperature-dependence occurred. Condensed-phase NOy did not vary in correlation with an 18 K temperature change, suggesting that a simple steady-state adsorption model is not adequate to account for all of the observations.
In collaboration with Geoff Tyndall, John Orlando, and Adele Chuck, a visitor from the University of East Anglia, Flocke and Swanson conducted laboratory experiments on the yield of alkyl nitrates from the photo-oxidation of simple branched alkanes. Particular emphasis was placed on the yield of tertiary alkyl nitrate species, since there was suspicion from experiments conducted earlier by Flocke, Tyndall and Orlando that the yields reported in the literature may be incorrect. The yield of a specific alkyl nitrate species from a parent hydrocarbon depends on 1) the rate constant ki for the attack of OH on the specific site forming the alkyl peroxy radical precursor to the alkyl nitrate molecule in question and 2) the branching ratio α of the reaction of the RO2 radical with NO which can result in alkyl nitrate production (minor channel) and in the production of NO2 and an RO radical:
RO2 + NO à RO + NO2 ki·(1-α)
RO2 + NO à RONO2 ki·α
Alkyl nitrate isomer formation from isobutane, isopentane, 2-methylpentane and 3-methylpentane was investigated. We could show that, for a given carbon number, the branching ratios α for primary and tertiary RO2 are very close to those of secondary species. This is in contrast to the values reported in the literature, where primary and tertiary RO2 have about a factor of two smaller branching ratios than the secondary species of the same carbon number. There is a general increase of α with carbon number which was reported previously. We also found that tertiary alkyl nitrates seem to be irreversibly adsorbed onto or destroyed on stainless steel surfaces, which is the likely reason for the incorrect branching ratios reported in the literature and also for the absence of these species in most air samples.
The dual channel fast gas chromatograph (fast PAN-GC) with electron capture detection was cross-calibrated against a total nitrogen oxide (NOy) instrument for the measurement of the peroxyacyl nitrates (PANs). The intercalibration determined the sensitivity of the fast PAN-GC for C2-C4 PANs by using a secondary preparative GC to purify synthesized liquid diffusion standards, which were subsequently analyzed on the fast PAN-GC and the NOy instrument. Results demonstrated a 95.5 ± 0.5 % conversion efficiency for PAN from the photolytic calibration source, and defined the response factors relative to that of PAN as 0.90, 0.64, and 0.55 for PPN, MPAN, and PiBN, respectively. This work was carried out in collaboration with James Roberts at NOAA AL. Results will be presented along with a full analytical description of the fast PAN-GC system in an article that is in preparation for submission to the Journal of Analytical Chemistry.
The current work of the PAN group focuses on the development and characterization of a novel Thermal Dissociation - Chemical Ionization Mass Spectrometer (TD-CIMS) method to replace the fast PAN-GC for the atmospheric measurement of peroxyacetyl nitrate compounds. The TD-CIMS system was newly developed by a collaborative group of scientists at NCAR and the Georgia Institute of Technology (Slusher et al., 2003). The ionization scheme uses a 10 mCi Po210 source to ionize CH3I to I- by alpha particle bombardment. The I- reacts with acyl peroxy radicals generated by the thermal dissociation of the PAN compounds in front of the inlet to form the acyl ion which is detected in the mass analyzer. The very low ionization potential of I- leads to a very selective ionization process that only reacts with the acyl peroxy radical species, and a few nitrogen oxide species (NO3 and N2O5). This method currently demonstrates a 3-10 pptv detection limit with a 1-10 second time resolution for PAN, PPN, PiBN, and APAN. Therefore the method will be ideally suited for fast measurements of fluxes in the boundary layer or for emission plumes on aircraft platforms. Atmospheric concentrations of PAN and PPN, as measured by the TD-CIMS instrument, showed good agreement (±10%) with those of our fast PAN-GC under field conditions.
A detailed laboratory characterization of the TD-CIMS instrument has been carried out in preparation for deployment on the NOAA P-3 research aircraft for the NOAA’s Northeast- North Atlantic (NENA) campaign in summer 2004. The TD-CIMS has been cross-calibrated against the fast PAN-GC and against the NOy instrument to determine calibration factors and relative sensitivities for the PAN homologues (PAN, PPN, PiBN, and MPAN) on the TD-CIMS. In addition, the PAN homologues have been produced in a 50 liter reaction chamber at the NCAR/ACD kinetics lab, in collaboration with Geoff Tyndall and John Orlando, where the TD-CIMS was cross calibrated against the long path FTIR connected to the reaction chamber. Additionally, some novel PAN homologues (1-hydroxyl-peroxyacetyl nitrate (HPAN), methoxyformyl nitrate (MoPN, and peroxybenzoyl nitrate (PBzN)) were also produced in the chamber to investigate the TD-CIMS measurement capabilities. HPAN appears to be very short lived under ambient conditions and the sensitivity could not be determined, while MoPN and PBzN had equivalent sensitivities to PAN on the TD-CIMS.
AON Figure 2: Time series of PANs measurements using the new TD-CIMS showing low background counts (left half) while sampling zero air and sensitive response (right half) when sampling outside air. A calibration signal from the PAN photosource is intermittently superimposed while on zero air. Note the logarithmic scale on the vertical axis.
Measurement Of Pollution In The Troposphere Group
The Measurement Of Pollution In The Troposphere (MOPITT) experiment has been operating for nearly three years now, providing atmospheric scientists with a multi-year, global view of carbon monoxide profile concentrations in the troposphere. The mission is a joint Canadian-US effort, and NCAR/ACD is responsible to NASA for the continued development of the data reduction algorithms and for operational data processing at every stage from instrument counts to calibrated radiances, through to globally retrieved carbon monoxide vertical profiles and methane total columns. MOPITT Version 3 validated tropospheric CO profiles are currently being processed and delivered to NASA for use by the international community. This is the first dataset of its kind, and represents a significant advance in satellite remote sensing of the troposphere.
The MOPITT group, including Jarmei Chen, Merritt Deeter, David Edwards, Proj Ldr, Louisa Emmons, Gene Francis, John Gille, Prog Mgr, PI, Ben (Shu-Peng) Ho, Lawrence Lyjak, Debbie Mao, Steve Massie, Daniel Packman, Barbara Tunison, Valery Yudin, and Daniel Ziskin, has been active in 3 main areas this year: (1) continued improvement of the data reduction algorithms, data processing, and delivery of the final products to NASA for later distribution to the community; (2) validation of the MOPITT data with independent correlative measurements to accurately assess data quality; and (3) use of the MOPITT data in tropospheric chemistry and transport studies. More information about the MOPITT project can be found at http://www.eos.ucar.edu/mopitt/ and http://www.atmosp.physics.utoronto.ca/MOPITT/home.html.
The new retrieval algorithm that was developed this year has required careful validation. Validation activities are essential at each level of the data processing to ensure a full understanding of the in-flight MOPITT performance, to allow characterization of measurement accuracy, precision, and resolution, and to point the way to needed improvements. The validation of the Version 3 MOPITT Level 2 data product (mixing ratio profiles and total column amounts) was performed by comparison with numerous in-situ aircraft measurements from fixed sites by Paul Novelli (NOAA CMDL), and from measurements taken during intensive field campaigns. As a result of this validation work, the status of the MOPITT Level 2 product has been upgraded from “provisional” to “validated”. This status change is an indication to the community users of the high quality of the data that has been provided by the NCAR MOPITT team. A paper presenting the validation results has been submitted to JGR (Emmons et al., Validation of MOPITT CO retrievals with aircraft in-situ profiles.)
The results of the validation of MOPITT CO with aircraft in-situ measurements from CMDL sites and from intensive field campaigns are shown in MOPITT Figure 1. This indicates the bias (MOPITT minus aircraft, in percent) for each validation profile, and shows that the general correlation is very strong. This work is continuing, and is important for characterizing the effect of the retrieval algorithm reconfiguration that was required following the loss of one of the instrument coolers and half the channels in April 2001. The Phase 2 product shows only small differences compared to that of Phase 1, with no apparent loss of vertical resolution. The culmination of the algorithm development effort, the retrieval reconfiguration, and the validation work, is that a multi-year MOPITT record is now available for examination. MOPITT Figure 2 shows the zonal average.
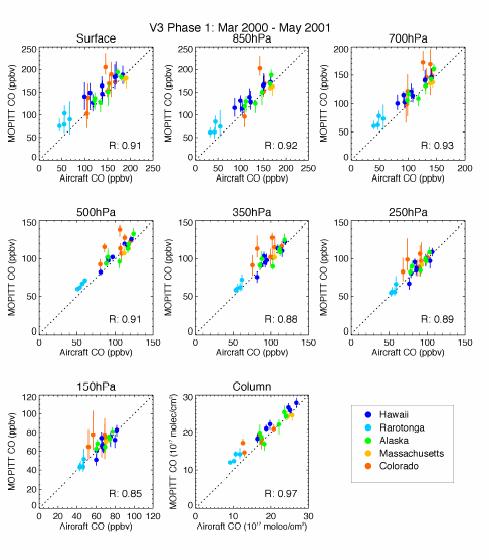
MOPITT Figure 1: Scatter plot of MOPITT versus aircraft data for each retrieval level and column, for Phase 1 data from the five CMDL sites (March 2000-May 2001). The in-situ aircraft data have been transformed with the averaging kernel and a priori profile. The error bars indicate the inter-quartile range for each MOPITT overpass. The dashed line is the 1:1 line and the correlation coefficient (R) is given.
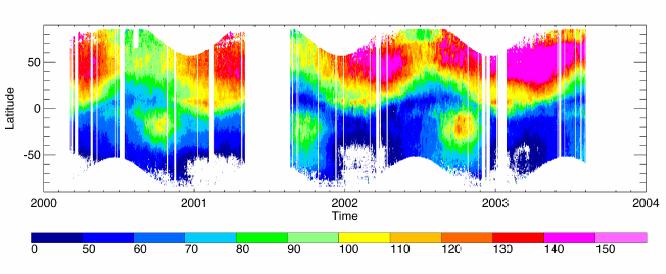
MOPITT Figure 2: Zonal mean MOPITT 700 hPa mixing ration (ppbv) as a function of year since the launch of the Terra satellite.
The combination of satellite retrievals of CO, NO2, aerosol, fire and lightning flash counts, can provide a powerful method for investigating the production of ozone precursors. Edwards, Lamarque, Emmons, and Gille, have used these sensor data in conjunction with in-situ measurements and chemical transport modeling to investigate the impact of biomass burning on tropical chemistry and to help explain the observed tropospheric ozone distribution over the Atlantic.
There has been considerable interest in the recent literature regarding the apparent Atlantic tropical tropospheric ozone “paradox” (Thompson et al., 2000; 2001). This can be summarized as follows: Most of the African northern hemisphere (NH) biomass burning in January and February occurs north of the intertropical convergence zone (ITCZ), while the maximum in most of the satellite-derived tropical tropospheric ozone (TTO) columns is observed in the southern hemisphere (SH) tropical Atlantic, south of the ITCZ. Apart from requiring a mechanism of significant ozone precursor production and inter-hemispheric transport across the ITCZ, it is also hard to reconcile this behavior with modeling studies and in-situ measurements which generally show high tropospheric ozone in regions of intense burning.
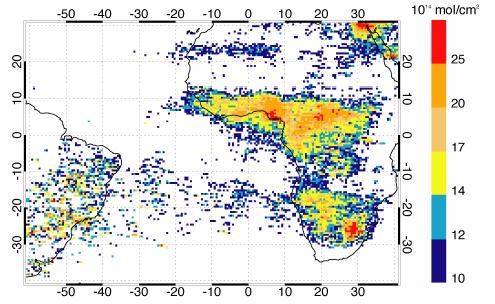
The mean MOPITT CO mixing ratio over Africa and the Atlantic for January 20-27, 2001, at 700 hPa, is shown in MOPITT Figure 3. The importance of biomass burning as a source of CO over northern equatorial Africa is readily apparent, and the northern extent of the plume correlates well with satellite observations of savanna fires. Emissions from the region of maximum burning in eastern Africa are generally transported southwest by the prevailing Harmattan flow to the ITCZ where convection takes place, and the plume ends up over southern central Africa or out in the Gulf of Guinea. Emissions from the fires in western Africa are advected westwards out into the Atlantic, suggesting that the ITCZ in this region presents a stronger barrier to interhemispheric transport. Once in the free troposphere, the CO from west Africa forms a strong plume that is caught in the tropical easterlies. MOPITT data show that this plume is persistent during the months December 2000 - April 2001, and that long-range transport carries CO to South America. Part of this plume crosses to the Pacific Ocean, while part is circulated over Amazonia. The absence of a significant CO plume in the southern tropical Atlantic suggests that it is unlikely that the north African fires are the origin of the observed Total Ozone Mapping Spectrometer (TOMS) TTO maximum.
Further information about ozone precursor distributions is provided by the ERS-2/GOME instrument. The January 2001, mean residual tropospheric NO2 vertical column is shown in MOPITT Figure 4. This can be compared directly with the MOPITT CO, and shows strong correlation with the peak CO concentrations over the fire locations. The westward extent of the NO2 plume over the equatorial Atlantic is not as great due to the shorter lifetime. Also evident are the significant levels of NO2 over southern Africa where very few fire counts are observed at this time. Elevated levels are also seen over South America and out into the southern Atlantic. The absence of significant low altitude CO plumes in these regions suggests a possible lightning source of NO2 in the mid-troposphere. Further evidence of this is provided by the fact that the areas of highest lightning flash density from other satellite observations corresponds well with the GOME NO2 observations. The resulting ozone would be advected westwards into the Atlantic, and may be one component of the ozone maximum observed in the TOMS TTO. This conclusion has been confirmed with a modeling analysis using the Model for Ozone and Related Chemical Tracers (MOZART)-2 Chemical Transport Model (CTM). This investigation has included the collaboration of Jean-Luc Attie and Jean-Pierre Cammas from the Observatoire Midi Pyrenees, Toulouse, France, and Andreas Richter of the University of Bremen, Germany. A paper detailing these findings was published in JGR, Edwards et al., Tropospheric ozone over the tropical Atlantic: A satellite perspective. This paper prompted press releases by, NASA, AGU, and NCAR, and was the subject of a number of reports in the electronic press.
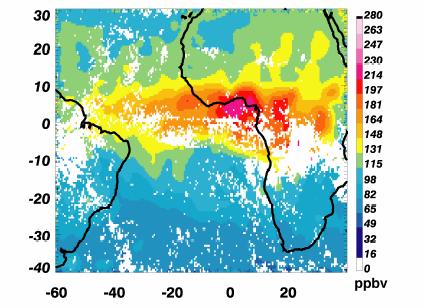
MOPITT Figure 3: MOPITT CO (ppbv) distribution at 800 hPa. Mean values for January 20-27, 2001. Data resolution is 0.5° longitude x 0.5° latitude.
MOPITT Figure 4: The January 2001 mean GOME residual tropospheric NO2 vertical column. Data resolution is 0.5° longitude x 0.5° latitude.
One of the major science activities by Gille, Valery Yudin, and Larry Lyjak, has been the use of assimilated data to investigate the transport of CO across the Pacific. An initial study defined the periods of major transport, in the Spring, and the primary latitudes involved. Subsequent analyses showed the source regions and transport paths in latitude and altitude. Not infrequently, plumes are observed to reach the West Coast of North America, although these do not appear to penetrate inland. Intercontinental transport to and from Europe has also been examined by Pfister using a combination of data from MOPITT, aircraft, and in-situ measurements in conjunction with MOZART-2 modeling studies.
MOPITT data has also been used by Lamarque and Edwards to examine the regional impact of localized emissions. During the summer of 2000, large wildfires burned more than a million acres over the Northwest and Rocky Mountain regions of the USA, with particularly high intensity in Idaho and Montana. The plumes from these fires are clearly evident in the MOPITT CO distributions, and indicate that the emissions spread across the USA reaching down into Florida in a manner consistent with the prevailing meteorology. The MOZART-2 CTM was used to investigate the CO emissions, initiated at the location of the fires as provided by Advanced Very High Resolution Radiometer (AVHRR) observations analyzed by the United States Forest Service, that were required to reproduce the CO enhancement above background levels that were observed by MOPITT. This analysis indicated that in the month of August 2000, the Western fires were responsible for some 9 Tg of CO, which is equivalent to about half the US anthropogenic emissions of CO for the same month. This work has now been published in JRL, Lamarque et al., Identification of CO plumes from MOPITT data: Application to the August 2000 Idaho-Montana forest fire. Similar studies are continuing to investigate the CO emissions and plume transport from the Colorado Hayman and Arizona Chedeski fires of the summer of 2002.
The MOPITT modeling team (Boris Khatattov, Yudin, Gabrielle Petron) has continued work on the assimilation of MOPITT data, profiles and total column independently, in the MOZART-2 global chemistry-transport model. The forecast model error specification has been revised in the assimilative code, and the effect of uncertainties in the analyzed winds, boundary layer venting, cloud mass fluxes, surface fluxes, and chemical production and loss continue to be examined. Work is starting on the direct assimilation of MOPITT Level 1 radiances into the MOZART-2 model. This will have the advantage of eliminating the traditional retrieval step in the data processing and allow a fully-consistent treatment of a priori information.
Gabrielle Petron, an NCAR/ASP
scientist working in the MOPITT team, has led an investigation of inverse
modeling using the MOPITT data and the MOZART-2 model to constrain surface
fluxes of carbon monoxide and assess the accuracy of emission inventories. This
work has also involved the collaboration of Claire Granier (University
of Paris). As a result of this investigation, a new set of monthly mean
surface CO emissions was produced for a full year and is available for
use in numerical simulations. Model results obtained with the new emissions
show significantly better agreement with independent measurements.
One of the most important findings is that anthropogenic emissions from both North America and Asia are in reality significantly larger than previously thought. Petron recently defended her PhD thesis with honors using results of this work. MOPITT Figure 5 shows the global anthropogenic CO budget separated by geographical region and emission type for the a priori estimates and the a posteriori estimates resulting from the inverse modeling of the MOPITT data.
Work on the assimilation of MOPITT data is also being carried out by Jean Luc Attie at the Observatoire Midi Pyrenees, Toulouse, France. Attie was previously a long-term visitor in the MOPITT group. The observational data are being assimilated into the Meteo-France chemical transport model MOCAGE (Modele de Chimie Atmospherique a Grande Echelle) using a Kalman-Bucy filter. This work is being used to assess the impact of the MOPITT CO assimilation on the simulated ozone field, by comparing first with model results without assimilation and with aircraft data from the MOZAIC campaign.
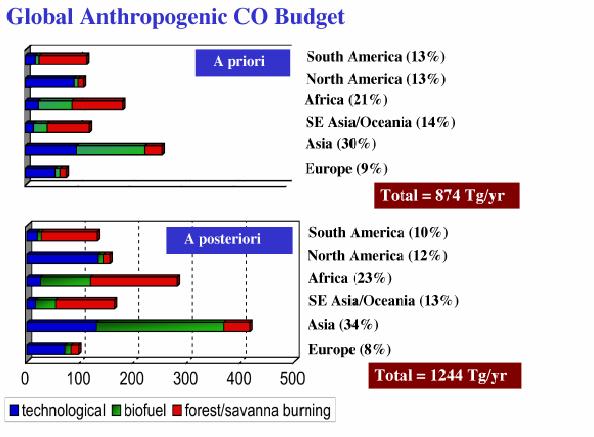
MOPITT Figure 5: Anthropogenic CO emissions by different sources and geographical regions from previous inventory estimates, a priori and after performing a linearized Kalman filter inversion of the MOPITT CO data at 700 hPa in conjunction with the MOZART-2 chemical transport model, a posteriori
Edwards is leading a study to investigate emissions from biomass burning in Africa and South America. This is a major source of pollution in the tropical troposphere and a major forcing of tropospheric chemistry. The outflow of both aerosol and CO from the widespread fires in southern Africa and South America during September-November, 2000, is being studied using observation from the Terra satellite, CO profiles from MOPITT and aerosol optical depth from MODIS. Recent developments in aerosol retrieval allow the distinction to be made between fine and coarse mode particles. The fine mode particles are produced by the same anthropogenic combustion processes that emit CO, and comparison of the fine mode aerosol and CO distributions provide information about biomass plume aging and the associated advection and convection of the emissions. The long range transport of these pollutants and the impact on atmospheric air quality in remote oceanic regions is also being studied, along with the seasonal changes in the pollutant distributions by comparing with the observations of CO and fine mode aerosol made during the December, 2000-February, 2001, period. A paper describing this work will soon be submitted to JGR.
MOPITT data are currently being made available to the National Institute for Space Research in The Netherlands (Ilse Aben and Anne Grete Straume) for use in CO validation studies for the recently launched European Environmental Satellite/SCanning Imaging Absorption SpectroMeter for Atmospheric CHartographY (Envisat/SCIAMACHY) instrument. A similar collaboration is underway with Larrabee Strow and Wallace McMillan at University of Maryland, Baltimore County (UMBC) who are investigating the potential for retrieving CO from the Aqua/ Atmospheric Infrared Sounder (AIRS) instrument. MOPITT data will also provide key validation of the CO retrievals expected from the Aura/Tropospheric Emission Spectrometer (TES) instrument to be launched next year.
As already noted, MOPITT data are particularly useful for providing a global context to localized measurements. In this respect, collaborations are underway with a number of groups involved in field campaigns. Validation of MOPITT measurements was a goal of the 2001 TRACE-P mission. The NCAR MOPITT team collaborated with the group of Daniel Jacob at Harvard University to compare with aircraft in-situ measurements taken during this campaign and to investigate Asian outflow into the Pacific. A paper detailing this work, Hearld et al., Asian outflow and transpacific transport of carbon monoxide and ozone pollution: An integrated satellite, aircraft and model perspective, is now in press at JGR. MOPITT data have also been provided to Paulo Artaxo (Sao Paulo University, Brazil) for use in the analysis of the results in the Smoke Aerosols, Clouds, Rainfall and Climate (SMOCC) campaign in Rondonia, Amazonia. There is also considerable interest in the role of mega-cities in pollutant production and a potential involvement of MOPITT in the ACD MIRAGE initiative in Mexico City.
MOPITT Operational Studies
The NCAR MOPITT team has been engaged in the ongoing data reduction process to produce geophysical quantities for scientific use by the community from the instrument count data. The elements of this processing capability and the people responsible, are: the data handling interfaces and protocols between NCAR and the NASA centers which receive and archive the satellite data and the ancillary meteorological data (Daniel Ziskin, Jarmei Chen); the Level 0-1 processor which calibrates the instrument counts to produce geolocated radiances (Ziskin, Debbie Mao, Chen); and the Level 1-2 processor which comprises a forward model which provides a full simulation of the MOPITT measurement, a cloud detection algorithm, and a retrieval algorithm (David Edwards, Gene Francis, Juying Warner, Merritt Deeter, Ben Ho, and Gille). The retrieval combines information from the measurements, the forward model, and previous measurements which define the current understanding of the atmosphere, to obtain the most likely CO profile or CH4 column consistent with the measured MOPITT signal. The Moderate Resolution Imaging Spectroradiometer (MODIS) cloud mask is also used operationally in the current data processing, and ensuring the smooth transfer of this data from NASA to NCAR in a timely manner has taken considerable effort on the part of Ziskin and Chen.
The algorithms continue to be developed as greater confidence in the instrument performance characterization is acquired over time. The data for the mission Phase 1, before the instrument cooler failure in April 2001, have been designated as a validated product. The data for the post-April 2001 period, Phase 2, are currently provisionally validated and will be upgraded to fully validated in the near future. Work has continued to characterize the instrument performance in the Phase 2 period, and to develop the retrieval algorithms to ensure maximum utilization of the instrument signal to retrieve CO vertical structure. A paper describing the operational MOPITT CO retrieval algorithm, Deeter et al., Operational carbon monoxide retrieval algorithm and selected results for the MOPITT instrument, was published in JGR in July.
The algorithms are now being prepared for the next data version 4. This includes a new forward model with improved description of the MOPITT gas correlation cells, and a new cloud clearing technique. Work has also continued on the characterization of MOPITT instrument noise issues to ensure that CO retrievals are not biased for different stares. The validation of MOPITT retrieved surface skin temperature using collocated MODIS measurements has been a major effort led by Ho. This has involved studies to quantify the sensitivity of the MOPITT CO, surface temperature, and emissivity retrievals to various underlying surface conditions, and has led to the development of an iterative retrieval algorithm using the MOPITT forward model together with collocated MODIS surface skin temperature to produce a global 4.7 µm emissivity database. This will be used in the new version 4 algorithm.
The MOPITT team has also begun production of a gridded level 3 product. This is intended mainly as a browse product since most modelers prefer to make their own gridded products according to their particular model resolution. The production of a gridded and time-averaged product is not as straight-forward as it might appear at first sight due to inherent differences between retrieval characteristics day to night, and between land and ocean. The MOPITT website continues to be developed. This is regarded as an important means of community outreach and education. The website currently includes details of how to obtain the data and how to use it correctly, along with other MOPITT references.
A major effort within the group in recent months was the definition of the Team Leader proposal to NASA, headed by Gille, to continue the refinement and improvement of the MOPITT data, and make further progress on the methane retrieval. Several areas in the CO retrievals were identified as needing further work, including the improved surface emissivities, correction for systematic errors in the forward radiance model, verification of error characteristics, and exploration of the use of variable a priori data.
Recently, there have been significant advances in the understanding of the high noise levels that were observed in the 2.2 micron solar reflectance channels that are used to obtain information about the CO and CH4 total atmospheric columns. This effort is being led by Gabriele Pfister, a visiting Erwin Shrodinger Fellow from Austria. Problems have been identified that prevent methane retrieval and potential corrections are being devised. The main issues relate to: polarization effects in the instrument, which affect the measurements mostly over ocean sunglint regions; high instrumental noise contribution in the signals over the ocean; stray-radiation in the instrument; and a spectrally varying surface reflectance over land. The latter causes complications in the retrieval because the retrieval theory requires the surface reflectance to be constant over the channel bandpass. It is hoped that the identification and characterization of these issues will enable a useful CH4 product to be obtained in the near future.
Characterization of the MOPITT calibrated radiances is a critical element of MOPITT validation. In the past year, a project was completed to validate the Level 1 radiances, and the results are described in a paper now in press by JGR. During this investigation, a correlation was discovered between CO concentration and radiance bias, possibly indicating a problem with the operational radiative transfer model. Resolving this problem should significantly improve the quality of future MOPITT CO products. The vertical resolution of the MOPITT CO retrievals is a key indicator of retrieval performance and is of interest to many end-users. However, vertical resolution is highly variable, and depends on retrieval configuration, surface temperature and emissivity, atmospheric temperature profile, etc. One index for quantifying vertical resolution is termed “Degrees of Freedom for Signal” (DFS). DFS approximately represents the number of layers in the retrieved profile which are retrieved independently. A project is now underway to quantify DFS and use it to investigate the dependence of retrieval performance on retrieval configuration (i.e., the subset of radiances activated in the retrieval algorithm), daytime versus nighttime, geographic surface types, etc.
The MOPITT Algorithm Test Radiometer (MATR) aircraft instrument team (Alan Hills, Janguo Nui, Deeter) has continued studies using the 2001 flight data taken (1) during April and May over the Oklahoma Cloud and Radiation Testbed (CART) site; and (2) during November over three Western U.S. cities (Los Angeles, Las Vegas, and Denver). These flights were supported with in-situ measurements by Paul Novelli (NOAA CMDL). Analysis of retrieval results for recent MATR measurements over the western cities show plumes of CO whose direction and distribution appear to agree well with the prevailing meteorology. A manuscript describing the MATR operation, recent flights, and scientific analysis of the data is in preparation.
Analytical Photonics and Optoelectronics Laboratory
The Analytical Photonics & Optoelectronics Laboratory (APOL) (Alan Fried, James Walega, and Dirk Richter) was established this past year at the NCAR Foothills complex. The new APOL group and facility is a joint Atmospheric Technology (ATD) / Atmospheric Chemistry (ACD) endeavor. The new state-of-the-art APOL facility was created to enable NCAR and visiting scientists, including national and international visitors, students, and teachers from area high schools, undergraduates, and graduate students to take advantage of recent advances in photonic and telecommunication laser-based technology for developing the next generation of advanced optical systems for ground and airborne atmospheric research. The APOL group has two overarching goals: a) To develop new technologies and advanced instruments for improved ground-based and airborne measurements, and b) To utilize the high quality data thus obtained to further advance our understanding of atmospheric processes and chemical transformations.
The new APOL facility was established with help from the NCAR Director’s Opportunity fund, and ACD and ATD shared responsibility for the support laboratory operations this past year. The new APOL facility required extensive modifications to an existing laboratory at the Foothills complex, and APOL personnel were involved in all aspects of this major endeavor, including: the planning, design and oversight of major laboratory modifications; the purchase of required infrastructure items (laboratory benches, workbenches, cabinets, tools, and scientific equipment); and the implementation of the subsequent move from the Mesa Laboratory to the new facility.
In addition to the requisite infrastructure support now available, the new APOL facility has approximately three times more useable space than the former Mesa laboratory. This aspect is particularly important for sustaining current and future simultaneous multiple research and development efforts. The new APOL facility, moreover, provides a new restricted access clean room for eye-safe development and characterization of new laser sources.
Scientists at the NASA Johnson Space Flight Center Toxicology Group have established spacecraft maximum allowable concentrations (SMACs) for a variety of selected airborne contaminants onboard the International Space Station. One such contaminant gas, formaldehyde (CH2O), is of particular concern since it emanates from a wide variety of common materials, including various foams and epoxies employed on the International Space Station. Despite the fact that these materials have been extensively tested and deemed safe by NASA and other groups, CH2O concentrations have continued to increase on the space station, and present levels now exceed the SMAC value of 40 parts-per-billion for exposure durations greater than 7 days. Upon learning of APOL’s capabilities to measure with high accuracy ambient CH2O levels three orders of magnitude lower than the SMAC level, NASA scientists immediately contacted the APOL group to seek advice and help. As a result, the APOL group formed a partnership with scientists from the University of Hartford to conduct a series of laboratory tests at the APOL facility to a) Measure CH2O emission rates from various foam and epoxy samples of the type employed on the space station, and b) Verify the veracity of the CH2O measurement approach (chemical badges) employed on the space station and its flow dependence. The latter is important to ascertain whether or not large differences in CH2O levels observed in different areas of the space station are real or are due to differences in badge response to different airflows.
These measurements were successfully carried out employing APOL’s airborne CH2O instrument and calibration standards. One particular type of foam used throughout the space station, melamine, was found to emit large quantities of CH2O and could account for the levels observed. The high sensitivity of APOL’s instrument was essential for the success of these measurements. Notwithstanding the high space station levels of CH2O, the emission flux concentrations from individual small foam samples tested were very low (less than 1.5 parts-per-billion and more typically an order of magnitude lower). In previous attempts to measure CH2O foam emission rates, the instruments employed could only resolve CH2O levels in the 10’s of parts-per-billion range, far too high for accurate quantification of CH2O sources.
The flow dependence of the chemical badge results was very small. However, the absolute values of the retrieved concentrations from these simple devices was nearly 100% too high when compared to APOL’s CH2O standards, which were used to test the badges. The high verifiable accuracy of APOL’s CH2O standards was essential to these tests. A report to NASA is in preparation summarizing these findings, and mitigation strategies will be devised in the future based upon these findings.
The trace gas CH2O is one of many important atmospheric species involved in ozone production and radical formation, (see “Advances in Tropospheric Chemistry,” below) and the APOL group has devoted a significant effort over the past several years to carry out ever more accurate and precise measurements of this gas. Although the present airborne system, which employs a liquid nitrogen-cooled lead salt diode laser, yields satisfactory results for most regions of the atmosphere, improved sensitivity is clearly needed in the background atmosphere where CH2O levels approach 30 to 50 parts-per-trillion (pptv). The present instrument sensitivity (15 – 50 pptv, 1s precision for 1 minute of averaging) needs to be improved for routine measurements in the background atmosphere, particularly in the upper troposphere/lower stratosphere where CH2O decomposition becomes a major source of reactive hydrogen radicals. To address this critical need as well as the need to develop smaller, lighter, and autonomous-operation instruments for future HIAPER campaigns, the APOL group has been developing a new high performance airborne instrument based upon difference frequency generation (DFG). In this approach, mid-infrared (IR) laser light at 3.53-mm, a spectral region where there are strong CH2O absorption lines, is generated employing well characterized room temperature operation near-IR telecommunication lasers. The mid-IR light retains all the high quality spectral and spatial qualities of the near-IR pump lasers (Richter et al., Applied Physics B, 2002), a significant advantage when compared to more traditional lead-salt diode lasers. Moreover, the ultimate instrument size will be significantly smaller and more rugged than our present lead-salt diode system. APOL Figure 1 shows an optical schematic of the laser sources and the non-linear crystal used in generating the difference frequency.
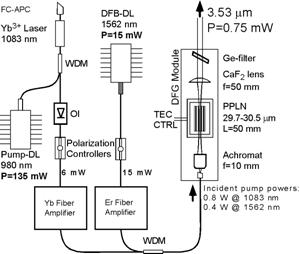
APOL Figure 1: Set-up of optical fiber based DFG-source: distributed feedback diode laser (DFB-DL);
wavelength division multiplexer (WDM); temperature controller (TEC-CTRL.)
This new DFG system has been extensively characterized in the laboratory over the past year. An important source of optical noise has been identified and present strategies are being implemented to circumvent this problem. Preliminary performance measurements employing one solution are extremely encouraging, and more rigorous laboratory tests are underway.
In addition to progress in the development of new and improved laser sources for the near-IR spectral, where a host of gases like CH2O exhibit strong absorption features, significant progress has also been achieved this past year in the development and testing of a new multipass absorption cell. The long optical pathlengths of multipass absorption cells (100 – 200 meters) are required to achieve detection sensitivities in the pptv range. In such cells, the laser beam is reflected back and forth hundreds of times, and this requires very high spatial beam quality as well as high beam pointing stability and cell alignment stability. The new DFG laser source addresses the first two requirements and significantly helps in achieving the third (to be discussed). By contrast, presently employed lead-salt diode laser systems and multipass cells fall short in all three areas on airborne platforms. In addition to poor beam quality, lead-salt laser systems, including our state-of-the-art airborne system, must employ numerous discrete optical elements before and after the multipass cell. As a result of cabin pressure changes, aircraft vibrations, and changes in aircraft attitude, the present components, including the multipass cell, all undergo slight alignment changes. Such changes degrade instrument performance and require human intervention for active rectification. Although we have been quite successful operating with these problems, a mechanically more robust optical system would reap significant benefits.
The APOL group has expended a great deal of time and effort this past year to address optical mechanical stability of the entire optical system, including the multipass cell and transfer optics. To our knowledge, a very limited number of groups throughout the world are actively addressing this very important issue. In addition to the very high spatial beam quality and beam pointing stability offered by DFG laser sources, the DFG module can be directly coupled to the multipass cell in a pressure-stabilized semi-sealed compartment. This not only avoids dust contamination on the transfer optics but also eliminates pressure-induced alignment changes. To be completely successful, this approach also required the development of a new pressure-insensitive multipass absorption cell. A visiting graduate engineering student, Christoph Dyroff, from the University of Applied Sciences, Emden, Germany has completed a 6-month project designing, constructing, and testing such a new cell for this purpose. In addition, he has carried out extensive sensitivity tests, including alignment sensitivity of the multipass cell output beam to the shape of the initial input beam. The high quality DFG input beam was found to be far superior to that from lead-salt diode lasers in this regard.
APOL Figure 2 shows a schematic of the new absorption cell with carbon fiber stabilizing rods and the new DFG laser stage directly coupled to the end of the cell. A number of preliminary tests have been carried out with this new cell in the laboratory, and the results directly indicate improvements in stability with changes in pressure. Additional studies are planned for this new cell as well as the entire optical system, including the new pressure-stabilized DFG module shown in APOL Figure 2. Once completed, a comprehensive refereed journal paper will be submitted this upcoming year and the new system will be employed next year on NASA’s INTEX airborne study.
![]()

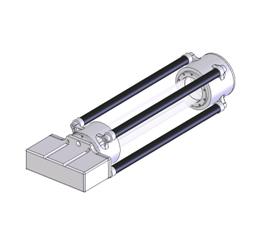
APOL Figure 2: New ultra-stable multipass absorption cell with sealed DFG laser/detector module directly mounted to the endplate of the cell.
Ultimately, we anticipate that this new laser source/multipass absorption cell system will require no active alignment in flight, a requisite for autonomous operation on HIAPER. In addition to CH2O, new DFG laser sources similar to that shown here can be devised throughout the 2.7 to 5-mm spectral region to access many other atmospheric gases of importance. As many research groups employ airborne IR laser absorption systems, the new approaches being developed by the APOL group and the subsequent technology transfer will ultimately lead to significant advances in measurement capabilities.
The APOL group has embarked upon a 3-year NSF-funded effort to exploit the developments in new DFG laser sources discussed above for high precision carbon dioxide isotopic ratio measurements. New approaches are urgently needed to acquire such measurements in real time. Present ultra high precision measurements acquired by flask sampling and mass spectrometry can only process a limited number of samples. The APOL group in collaboration with partners from the University of Colorado and Rice University have made considerable progress in the development of a new instrument. APOL Figure 3 illustrates the optical schematic of such a system, which is presently under construction. The signals from two cells containing the sample gas and an isotopic reference standard are rapidly compared using the setup shown in this figure.
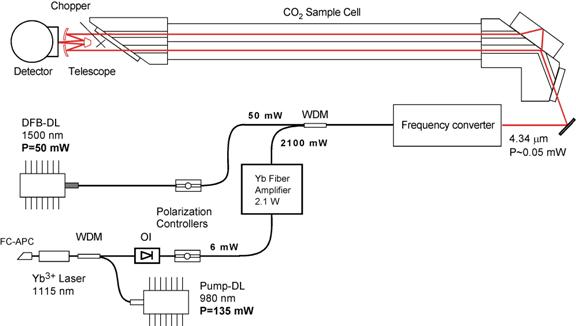
APOL Figure 3: Optical schematic of a DFG-based system for high precision carbon dioxide isotopic ratio measurements.
In addition to the optics, a comprehensive inlet system was designed, which allows multiple combinations of calibration reference gases and/or sample gases to be directed into one or both cells. This system is presently under construction, and comprehensive tests will be carried out this upcoming year. A graduate student from Rice University, Chad Roller, has joined our group and is working on multiple aspects of the new system, including the data acquisition and retrieval algorithms.
As part of this new effort, the APOL group hosts each summer two teachers and students from local area high schools to help APOL scientists work on all phases of this project. This effort is in partnership with NCAR’s Education and Outreach Program. The first summer has just been completed, and the students/teachers were exposed to a number of new concepts, including carbon dioxide research and the utility of high precision isotopic ratio measurements; absorption spectroscopy and how one employs laser light sources to obtain quantitative results; and telecommunication lasers, fiber optic technology, and new non-linear mixing processes.
The students/teachers were very enthusiastic about their experiences and are in the process of preparing a presentation/demonstration for the Colorado Science Convention. A demonstration system is being constructed in an effort to allow high school teachers to bring advances in carbon dioxide research, such as the new system being developed at NCAR, into the classroom.
The APOL group has been involved over the past several years in efforts to advance our understanding of tropospheric chemistry. This effort has continued this past year in the newly formed joint ATD/ACD group. Specifically, highly accurate and sensitive measurements of CH2O, acquired during the 2001 NASA-funded TRACE-P campaign, were analyzed and published in a recent special issue of the Journal of Geophysical Research (Fried et al., 2003). A number of new findings from this study have been discussed in last year’s ACD Annual Scientific Report, and one finding not included in that report is presented here.
Comparisons of CH2O measurements with those from box model calculations in all atmospheric regimes are an important component for further assessing our understanding of atmospheric processes. Unfortunately, measurement-model comparisons, even for remote background conditions where CH4 oxidation is the primary CH2O precursor, have sometimes exhibited both positive and negative deviations. These discrepancies clearly point to gaps in our understanding of CH2O production and destruction pathways, and hence in tropospheric oxidation processes. One such regime is uptake of CH2O in clouds and on marine aerosols. Although such uptake has been predicted and has been modeled, many complicating factors tend to obfuscate the observation of such uptake. In some cases where large CH2O uptake has been suspected, questions regarding measurement accuracy have been raised. For example, Jacob et al. (JGR, 1996) report large CH2O model overpredictions by a factor of 4 in airborne measurements carried out near the ocean surface over the South Atlantic Ocean. Jacob et al. raise the possibility of a large unknown oceanic sink or measurement error.
The newly published study by the APOL group (Fried et al., 2003) report for the first time clear evidence of CH2O uptake in clouds. In one case, measurement-model comparisons revealed a peak uptake of 85% upon entering a cloud where the complicating effects of pollution were not present. This same study also revealed large CH2O uptake in the lower marine troposphere in the presence of haze. These observations are important for furthering our understanding of radical chemistry and transport over the oceans and how such chemistry may be altered by the presence of clouds and marine aerosols.
Atmospheric Radiation Investigation and Measurement Group
Atmospheric Radiation Investigations and Measurement (ARIM) Group (Richard Shetter, Teresa Campos, Edward Riedel, Samuel Hall, and Barry Lefer) concentrated much of their effort this year on data reduction and analysis from several campaigns undertaken last 18 months. Additional effort was placed in developing new instrumentation for actinic flux measurements that will be applicable to new aircraft platforms like HIAPER and aircraft direct beam irradiance measurements.
ARIM Highlights
A new instrument to measure direct solar beam irradiance as a function of wavelength from aircraft was developed with NSF and NASA funding. This instrument was flown on the NASA SAGE-III (Stratospheric Aerosol and Gas Experiment – III) Ozone Loss Validation Experiment – II (SOLVE-II) mission to determine overhead ozone column and aerosol optical depths (as a function of wavelength) in support of the validation activities for the SAGE-III satellite instrument. Data was collected on 10 science flights probing the Arctic polar vortex with the NASA DC-8 based out of Kiruna, Sweden. There were numerous encounters with polar stratospheric clouds (ARIM Figure 1) and intense auroral activity (ARIM Figure 2).
Data collected is currently being finalized and will be compared with other solar instruments deployed on the DC-8 and with various satellite datasets. Details of the instrument development and data examples appear below.
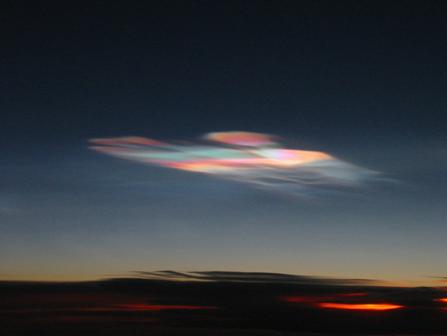
ARIM Figure 1: Polar stratospheric cloud off the coast of Iceland observed from the NASA DC-8 during SOLVE-II
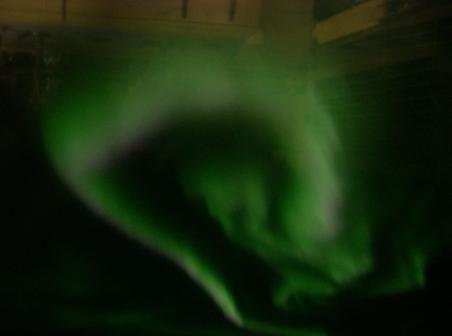
ARIM Figure 2: Auroral activity viewed from the NASA DC-8
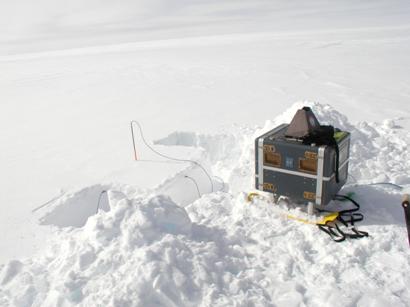
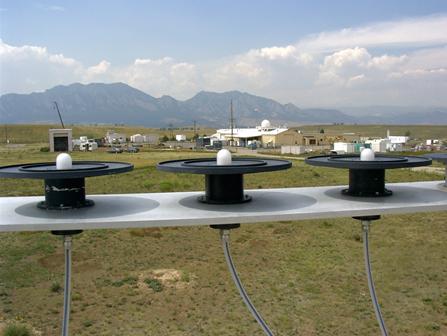
Sunlit snow has been shown to be one of the most photochemically active, and strongly oxidizing, regions of the entire troposphere, rather than simply a passive sink for the products of tropospheric chemical processing. Photolysis of nitrate initiates very active chemistry that leads to the release of a number of important trace gases. Initial measurements suggest that just above sunlit snow the production of HOx from photolysis of HCHO, HOOH, CH3CHO and HONO are all significant, and collectively dominate over photolysis of O3. The net result is a large enhancement of OH and HO2 in air just above the snow. Oxidation by OH is the main sink for a number of gases important for climate change and stratospheric O3 depletion, so this enhancement may perturb chemistry in much of the free troposphere, and also modify the chemical records of atmospheric composition ultimately preserved in glacial ice. In an NSF Polar Programs-funded Collaborative Research Project with 5 different university investigators and one national laboratory investigator, the ARIM group developed and deployed a new automated instrument to measure the UV radiation flux profile in the surface snowpack. This instrument was deployed for two months in the Summer of 2003 to Summit, Greenland. The Summit base camp is show in ARIM Figure 3. All measurements were actually collected at a remote photochemistry camp to eliminate the possibility of contamination from the base camp generators and other human activities (see below for instrument description and preliminary data).
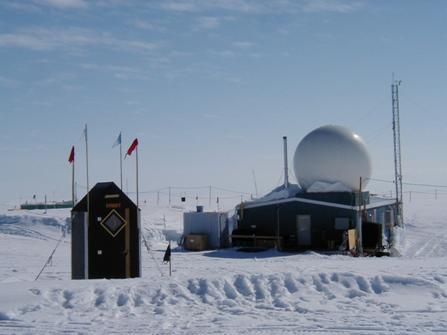
ARIM Figure 3: Summit, Greenland base camp
A spectroradiometer to determine the direct beam solar irradiance from 290 to 700 nm has been developed with joint NSF and NASA funding. Direct beam irradiance data can be used to determine the slant path ozone columns and wavelength dependent total and aerosol optical depths. The instrument is comprised of 3 subsystems: a narrow field of view optical collector, an active solar tracking system, and monochromator detection systems. The instrument is represented schematically in ARIM Figure 4. The DIAS system was deployed for the first time on the NASA DC-8 aircraft during the SOLVE 2 mission for use in validation of the SAGE III satellite instrument. The aircraft installation on the NASA DC-8 is shown in ARIM Figure 5.
The narrow field of view collection optic accepts the direct solar beam while excluding almost all of the atmospherically-scattered radiation. While the entire solar disk could be sampled with a ~0.5° field of view, a 2.6° field of view allows for some inaccuracy or short time lags in the response of pointing system. The collection optic is mounted to the pointing system at the center of rotation of the x-axis and y-axis and is optically connected to the detection system with a flexible UV fiber optic.
The solar tracking system contains a commercially available 2-axis gimbal, a position sensing system, and a custom embedded controller system. The Sagebrush Technology Model-20 servo gimbal has a large range of motion, positional resolution of 0.004° and angular travel rates up to 120° per second. The gimbal is controlled by communication with RS-232 commands or a commercial grade joystick. The position sensing detector system consists of a focusing lens, neutral density filter, and a duolinear position sensing module connected to a position sensing amplifier mounted on the gimbal platform. A lens focuses the image of the solar disk on the position sensing detector and the amplifier produces x and y-axis voltages which are directly proportional to the image position on the detector. Changing solar intensity is accommodated by the multiple amplifier gain ranges available on the amplifier module. The embedded controller control and data acquisition system is based on a Motorola 68338 single board computer (Persistor CF-1). This low power computer is interfaced with a 4 channel 16-bit analog to digital card (OES AD16S) and a 4 port serial interface card (OES U4S) and collects the X and Y analog data, issues RS-232 commands to the gimbal, and records positional data and times to a compact flash card
The double monochromator detection systems employ a fused silica fiber optic bundle, f matching optic, 1/8 meter scanning double monochromator (CVI CM112), UV sensitive photomultipliers, custom 4 channel electrometer/amplifier, and rack mount data acquisition and control system. This system is based on an instrument used by Shetter and Müller [1999] for wavelength dependent actinic flux measurements from aircraft. The full width at half maximum (FWHM) of the double monochromators is 1.0 nm using 2400 g/mm gratings and 600 micron entrance and exit slits which produces a symmetrical triangular slit function.
The diode array monochromator detection system employs a fused silica single fiber optic, a fixed monolithic monochromator (Zeiss MCS), a cooled windowless 512 pixel diode array detector, and a rack mount data acquisition and control system. The system produces spectra from 300 to 700 nm with a 2.4 nm FWHM.
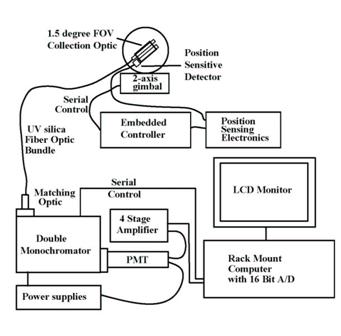
ARIM Figure 4: Schematic representation of the Direct beam Irradiance Airborne Spectroradiometer (DIAS)
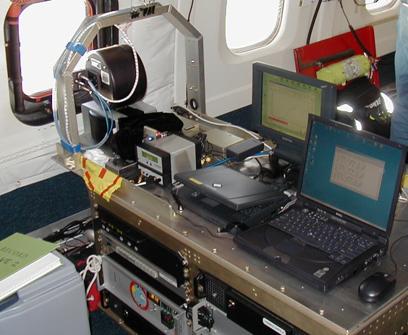
ARIM Figure 5: Installation of DIAS on the NASA DC-8
Instrument sensitivity calibrations of the 3 systems were done in the ARIM laboratory before and after the SOLVE II mission with NIST traceable 1000 watt QTH radiation sources. During the deployment, system sensitivities were tracked with secondary calibration sources before and after each flight. Since the major uncertainty in the direct beam irradiance determinations is the uncertainty in the radiation source flux, these calibrations are critical. In addition to source uncertainties transferring calibrations from the source flux to a solar flux that is orders of magnitude higher induces additional error. In an attempt to understand these uncertainties ARIM staff have performed additional calibrations using the Langley technique which uses the sun as a source. The instruments were taken to Rocky Mountain National Park at elevations of ~12,000 feet. When the conditions included clear skies and clean air masses from the west we were able to obtain representative Langley plots to independently determine instrument sensitivities. These calibrations are being compared with the lamp calibrations done in the lab and during SOLVE II.
Wavelength calibrations using a mercury discharge line source were also performed before and after each flight during the mission. These calibrations provided data which demonstrate the differences in the wavelength assignment of the monochromators from the accepted literature values. These differences vary between <0.1 nm to 1.1 nm and can vary with wavelength. Wavelength errors are especially important in areas of the solar spectrum where there are large intensity changes over short wavelength ranges, as seen in the UV-B to UV-A region. ARIM has done some preliminary comparisons between the wavelength assignment differences from the mercury calibrations and those calculated using a convolution/deconvolution algorithm (Slaper et al. 1995) and found the results to be quite comparable. Therefore we will run the algorithm on all of the SOLVE II spectra taken with the 3 detectors to correct the wavelength assignments.
Development of a new data reduction algorithm to calculate ozone column and line of sight ozone data from the Chappius band direct beam irradiance data has been necessary since the original algorithm developed for ozone column determinations was based on UV-B wavelength pairs and very little data in the UV-B was collected during SOLVE II, due to the large solar zenith angles (mostly 88.5° to 90.2°) during the solar runs for the SAGE III occultations. See ARIM Figure 6 for some preliminary ozone column results from the new algorithm.
ARIM Figure 6: Ozone column measured from NASA DC-8 during SOLVE-II
The algorithm for calculation of wavelength dependent total and aerosol depths has been refined and preliminary data was submitted to the mission archive. Final data reduction and analysis using the new calibration values is in progress. See ARIM Figure 7 for some preliminary Aerosol Optical Depth (AOD) results.
Direct comparisons of the DIAS data with data from the other solar instruments on the DC-8 and the SAGE III satellite for AODs are planned.
ARIM Figure 7: Aerosol Optical Depths for different wavelengths during SOLVE-II
Sunlit snow has been shown to be one of the most photochemically active, and strongly oxidizing, regions of the entire troposphere, rather than simply a passive sink for the products of tropospheric chemical processing. Photolysis of nitrate initiates very active chemistry that leads to the release of a number of important trace gases. Initial measurements suggest that just above sunlit snow the production of HOx from photolysis of HCHO, HOOH, CH3CHO and HONO are all significant, and collectively dominate over photolysis of O3. The net result is a large enhancement of OH and HO2 in air just above the snow. Oxidation by OH is the main sink for a number of gases important for climate change and stratospheric O3 depletion, so this enhancement may perturb chemistry in much of the free troposphere, and also modify the chemical records of atmospheric composition ultimately preserved in glacial ice. While recent work has shown that photochemical and physical processes in the snowpack can impact the chemistry and composition of both the atmosphere and snowpack, these processes are, in general, poorly understood. This is especially true for the processes that produce and consume OH and HO2.
In an effort to better understand this photochemical environment, the ARIM group has developed a new profiling spectroradiometer to determine the intensity of solar UV radiation at 5 different depths in the surface snowpack (ARIM Figure 8). This instrument serially samples the radiation field from 290 to 420 nm from 5 different fiber optic cables inserted into the snowpack at different depths between 1 and 150 cm. These snowpack profiles of solar irradiance were used to determine the attenuation rate of UV in the snowpack and how this varied with changes in environmental variables such as snowpack density, soot content, solar zenith angle (SZA) and overhead ozone column. Given the isotropic nature of the radiation field in the snowpack the measured irradiance spectra were converted to actinic flux spectra and the photolysis frequencies of several important snowpack photochemical reactions were calculated for the different sampling depths. This data has helped determine that the photic zone (or photochemically active region) of the snowpack is only the top 15 cm of the Greenland snowpack. This instrument was deployed for the months of June and July 2003 at the Greenland Summit Ice Camp (ARIM Figure 9) as part of the NSF-funded Collaborative Research Grant titled: “Impact of snow photochemistry on atmospheric radical concentrations at Summit, Greenland.”
ARIM Figure 8: NCAR Snow Profiler in Greenland
The NCAR Snow Profiling spectroradiometer (NSPS) instrument consists of a small cosine-corrected irradiance probe (Ocean Optics), 5m fiber-optic with high UV throughput (Ocean Optics), a precision computer controlled dovetail slide (Velmex), a double monochromator (CVI Digikrom CM 112), a photomultiplier tube with a bialkali photocathode (Electron Tubes, LTD), a custom four-stage current-to-voltage amplifier and a PC computer for fully automated data acquisition and system control. Spectra from 280 to 420 nm are scanned every 30 seconds. The spectral band pass full width at half maximum (FWHM) for this optical system is 1.0 nm. Absolute spectral calibrations are performed with a National Institute of Standards and Technology (NIST) traceable 1000 Watt QTH irradiance standard in the NCAR laboratory before and after instrument field deployment. Field calibrations are performed with 250 W secondary QTH lamps every 4 to 5 days to assess the relative stability of the instrument sensitivity. Wavelength calibrations of the monochromator are performed in conjunction with each sensitivity calibration using the emission lines from a mercury lamp to track any drift in the monochromator wavelength assignment.
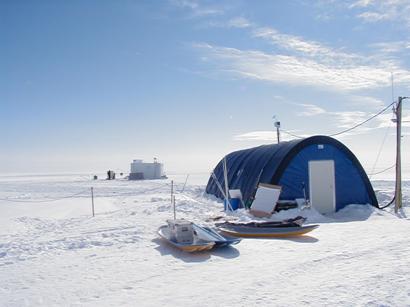
ARIM Figure 9: Summit, Greenland snow photochemistry camp
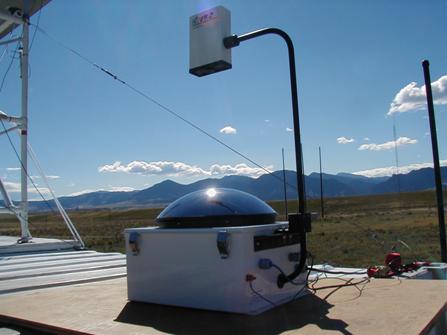
An NCAR Scanning Actinic Flux Spectroradiometer was also deployed to Greenland to measure the UV radiation incident to the snowpack surface. The quartz optical collector for this system was mounted on the roof of the mobile sampling laboratory (ARIM Figure 10) and had a 30 cm artificial horizon to limit the field of view to 2pi steradians to minimize the influence of reflected light from the other sampling inlets.
It is quite difficult to measure snowpack radiation levels due to issues of self-shading by the optical sampling inlet. To this end, our lab has selected miniaturized Teflon sampling inlets (approximately 1 cm in diameter and less than 2.5 cm long), which attach directly to the end of a fiber optic using an SMA connector. These miniature-sampling inlets were inserted into the snowpack at a location near the gas sampling activities at 5 different depths between the surface and 1.5 meters. Each sampling inlet was attached to a 5m fiber optic cable that was connected to the same spectroradiometer. The snow spectroradiometer serially sample each of these 5 depths, thus collecting a complete snow profile every 2.5 minutes. The above-snow spectroradiometer continuously measured the actinic flux reaching the snow surface, which can account for any changes in the light environment (e.g., due to clouds) while a specific snow profile is being collected.
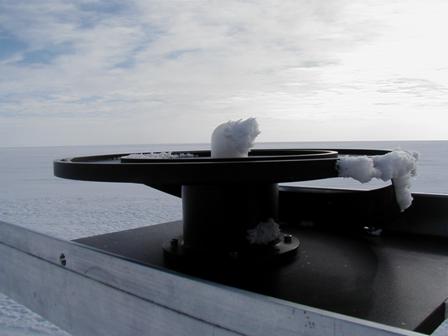
ARIM Figure 10: Above-snow SAFS optic with rime ice deposition
Profile measurements of the downwelling UV actinic radiation in the snowpack at Summit, Greenland show an exponential decrease with depth in the snowpack. The e-folding depths (1/e attenuation) calculated from the profile shown in ARIM figure 11 shows a wavelength dependence of the penetration of UV/VIS radiation ranging from 20 cm at 420 nm to approximately 14 cm at 310 nm. These results suggest that 85% (i.e. 2 e-folding depths) of the photochemical activity is occurring in the top 28-40 cm of this snowpack. This project will continue with a second field season at the Summit Ice Camp from March to April 2004.
ARIM Figure 11: Preliminary e-folding measurements from Summit, Greenland
The ARIM group has deployed ground based and airborne Scanning Actinic Flux Spectroradiometer (SAFS) instruments for the determination of actinic fluxes and photolysis frequencies for the last 6-7 years. These have operated well but have limited time resolution (~10 seconds for a spectrum) and require frequent calibration and maintenance. A new instrument based on a monolithic monochromator with a UV enhanced windowless CCD detector is being developed. This instrument is smaller and lighter with a new PC-104+ data acquisition and control system, should be quite reliable, and be able to collect actinic flux spectra from 280 to 680 nm at 1-10 Hz allowing for fast photochemistry investigations. The smaller design will allow for deployment on aircraft platforms with limited space for instruments and operators like the NSF High-performance Instrumented Airborne Platform for Environmental Research (HIAPER) aircraft. The instrument is currently being tested and will be intercalibrated with the existing scanning monochromator systems in the near future.
The ARIM group analyzed the actinic flux dataset taken during the NASA Transport and Chemical Evolution over the Pacific (TRACE-P) Mission from the spring of 2001. This analysis consisted of comparisons of modeled and measured actinic flux and the calculated photolysis frequencies. Chemical transport model (CTM) output for the cloud and aerosol parameters was used as inputs to the radiative transfer model (RTM). During clear-sky periods, the instrumental data and RTM photolysis frequencies were compared to evaluate the CTM aerosol output parameters. The measured and modeled photolysis frequencies were also input into a photochemical box model to look at the impact of clouds and aerosols on ozone photochemistry. These results were published in two collaborative papers in the Journal of Geophysical Research.
In an effort to improve the state of the science for the measurement of actinic flux radiation and the calculation of photolysis frequencies, the ARIM group hosted an informal international actinic flux spectroradiometer intercomparison for 6 weeks in August and September 2003 at the NCAR Marshall Field site (ARIM Figure 12). The ARIM group deployed three Scanning Actinic Flux instruments, a diode array instrument, and 4 j-NO2 filter radiometers and also provided 1-minute temperature, pressure, and cloud camera images (ARIM Figure 13) to the other intercomparison participants. The other participants included scientists from the Institut fur Tropospharenforschung-Leipzig that compared 2 diode array spectroradiometers, as well as scientists from the NOAA Aeronomy Laboratory-Boulder that compared a dual channel double monochomator spectroradiometer with a CCD detector as well as 2 j-NO2 filter radiometers. Data for final comparisons is currently being analyzed.
ARIM Figure 12: View of some instruments participating in intercomparison at Marshall Field Site
ARIM Figure 13: ARIM Cloud Camera during the intercomparsion.
Photochemical Oxidation and Products Group
The Photochemical Oxidation and Products (POP) Group studies fast photochemistry, sulfur chemistry, ion chemistry, particle nucleation, and the chemical composition of ultrafine particles. Its members include Fred Eisele, Roy Leon Mauldin, James Smith, Edward Kosciuch, Bruce Henry, and Katharine Moore (ASP).
A linear ion trap mass spectrometer has recently been developed and successfully tested. It offers high ion throughput and trapping efficiencies and can resolve individual ion masses over a wide range and in a short time relative to the ion collection time (POP Figure 1). This makes it an ideal instrument for rapid, near simultaneous measurements of numerous organic compounds. Preliminary progress has also been made in fragmenting ion clusters and the subsequent measurement of daughter ions on this same instrument.
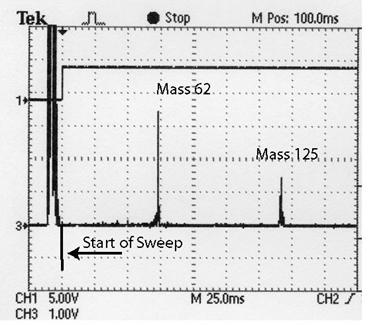
POP Figure 1: Mass spectrum of NO3- and its first nitric acid cluster obtained using a recently developed linear ion trap
In an attempt to improve the planning process for the future ACD MIRAGE study, an NCAR Advanced Study Program (ASP) / University of Colorado graduate student was sent to Mexico City this past spring to perform initial measurements of ultrafine aerosol particles. This study was also a joint effort with Peter McMurry’s group at the University of Minnesota and resulted in the measurement of many relatively intense aerosol nucleation events, an example is shown in POP Figure 2. This study provided the first direct evidence of nucleation events in and near Mexico City and will be used to help determine future instrument needs and the aerosol study location to be used during MIRAGE.
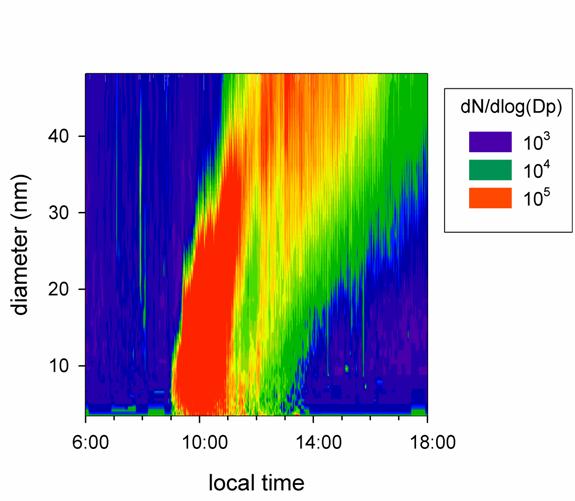
POP Figure 2: Nanoparticle size distribution measurements as a function of local time performed at Santa Ana, a rural town located at the southeastern edge of the Mexico City Federal District. The red color at the bottom of this figure shows the initial results of an intense nucleation event. The subsequent growth of these aerosols over the next several hours is then shown as the red moves to larger sizes and later in time.
The POP Group has undertaken a number of research efforts during the past year. In the area of gas phase measurements, the final data analysis and manuscript preparation were completed for the NASA/Global Tropospheric Experiment (GTE) Transport and Atmospheric Chemistry near the Equator (TRACE-P) mission and the NSF/Polar Programs Investigation of Sulfur Chemistry in the Antarctic Troposphere (ISCAT) 2000 mission. Three TRACE-P papers are either in press or published, and one ISCAT paper is ready for submission. Some preliminary work on an instrument to measure gas phase ammonia concentrations is presently underway. A redesign of the prototype was recently completed and will be tested shortly. This research is being supported in large part by funding from the NASA/GTE program, but the resulting instrument will be used to study ammonia and its role in particle nucleation and growth in both future NASA (most likely Intercontinental Chemical Transport Experiment [INTEX]) and NSF (MIRAGE and probably UTLS) field campaigns.
The group has also put considerable effort into both improving present instruments and at the same time testing new techniques that will allow smaller instruments to be designed in the future. These smaller instruments would be able to measure more quickly and also study a broader range of compounds. The initial phase of this effort during the past year involved the replacement of an electrostatic ion lens system with an octopole radio frequency (RF) lens system in a two-channel mass spectrometer system. This resulted in about a four-fold increase in ion signal under relatively low vacuum pressure conditions. This was then followed by the design of a conical octopole lens system to be installed in a differentially pumped section of a mass spectrometer vacuum chamber. This will be tested shortly on the OH channel of the 4 channel mass spectrometer. If successful, it would allow a significant reduction in the size and vacuum pumping requirements of future mass spectrometer systems.
A major goal of future studies is to provide new, more sensitive and more chemically-specific measurements of numerous organic compounds, both in the gas and aerosol phases. To accomplish this, tandem mass spectrometers and an ion trap mass spectrometer with a combined spectrometry (MS/MS) capability are obvious candidates. While tandem mass spectrometers provide high ion throughput, they measure parent and fragment ions in a serial mode and thus require significant time to acquire a spectrum. Standard ion traps acquire spectra in a quasi-parallel manner by trapping and storing a wide range of ion masses and then analyzing them in a time short compared to their collection. The overall trapping and analysis efficiency of a standard ion trap, however, is quite low. Thus, recent research efforts have led to the conversion of a quadrupole mass spectrometer, already designed for atmospheric studies, into a linear ion trap mass spectrometer. Mass spectra were first measured with this new technique a few months ago, and the linear trap offers both high ion throughput and high trapping efficiency (see POP Figure 1). A preliminary attempt to fragment ions and measure daughter ion spectra was also successful, but thus far it has only been successful with weakly bound ion clusters. The next step will be to fragment more stable ion species.
Other areas of instrument upgrades include the development of a better, more field-portable method for calibrating UV diodes, which are in turn used to calibrate OH and sulfuric acid measurements during field studies. A gas phase calibration box for calibrating ammonia measurements was also improved as part of Okason Morrison’s SOARS project, and the OH aircraft calibration system is being fully automated.
A large effort has also been put into improving and expanding aerosol measurement capabilities. In order to develop improved techniques for measuring the chemical composition of ultrafine aerosols and at the same time better understand the local aerosol environment, several one- to two-month-long continuous measurements were performed of air from just outside the laboratory during each season. This allowed seasonal changes to be tracked and at the same time provided an opportunity to optimize instrument performance under varied conditions. Various parts of the Thermal Desorption Chemical Ionization Mass Spectrometer (TDCIMS) system used for these studies are still undergoing multiple improvements, so the ability to directly compare measurements from different seasons is still somewhat limited, but new understanding is nonetheless being gained. Among the surprises observed in this measurement set was a large source of nitrate ions which were part of a relatively stable complex, but do not appear to originate from ammonium nitrate. Techniques for better understanding the source of this nitrate are being investigated. Several nucleation events have also been observed and provide a test of the ability to measure the chemical composition of very small particles.
One major modification of the TDCIMS instrument was also made this past year. The electrostatic precipitator, thermal desorption filament, and housing assembly were all reoriented to reduce turbulent mixing of sample and sheath gases. The ion source also had to be completely redesigned and rebuilt to accommodate the above change. The improvements were quite successful, however, and background contamination of the collection filament has been largely eliminated.
A preliminary study of ultrafine aerosol concentrations in Mexico City was also conducted this past spring. This study was part of a collaborative effort with Peter McMurry, Jose-Luis Jimenez, University of Colorado, and the ASP Graduate Studies Fellowship Program and was designed to provide input data for the aerosol nucleation portion of the upcoming MIRAGE study. It was quite successful, and several different types of nucleation events were documented (see POP Figure 2).
Data from last year’s Atlanta Aerosol Nucleation And Real-time Characterization Experiment (ANARChE) study organized by the University of Minnesota is still being analyzed. This study was the first field deployment of the TDCIMS, which performed well and generated much unique new data. The first instrument paper describing the TDCIMS instrument was published this past year (D. Voison et al., Aerosol Sci. Technol., 2003), a second is in press and several more papers describing its use are in preparation.
Finally, the preliminary design work and component acquisition for a tandem differential mobility analyzer has been completed, and the new instrument will be assembled this fall. This new instrument will complement the TDCIMS system by providing hygroscopicity and volatility measurements that can then be combined with TDCIMS chemistry results.
The major international activity in the past year was our measurement of ultrafine aerosol size distributions in Mexico City. These were carried out during the Mexico City Metropolitan Area (MCMA)-2003 field campaign, and were performed both within the Federal District, and outside the District in a rural mountain pass region. We also analyzed data from the South Pole.
Atmospheric Radical Studies Group
The Atmospheric Radical Studies (ARS) Group (Chris Cantrell) is involved in the measurement and interpretation of peroxy radical levels in laboratory and atmospheric measurement situations.
Observations of peroxy radicals and other species during TRACE-P were used to estimate the efficiency of uptake of peroxy radicals and radical precursors onto aerosols and cloud droplets. This was done by comparing binned observations with two independent, constrained models (that do not include heterogeneous uptake in their mechanisms) as functions of aerosol surface area density, and cloud liquid water content. The ratios of observations to models are consistently lower at higher aerosol surface area densities (ARS Figure 1) and higher cloud liquid water contents (ARS Figure 2), hinting that reduction in radical concentrations relative to the models is possibly due to heterogeneous interaction with aerosols and cloud droplets. These observations are consistent with laboratory studies that show that aqueous aerosols can scavenge HO2.
ARS Figure 1: Measurement/model ratios of HO2 + RO2 concentrations binned according to ambient aerosol surface area density which was estimated from observed dry aerosol surface area density corrected for hygroscopic growth. Black points utilize the NCAR steady state model (with C2-C4 carbonyl and C1-C2 alcohol compounds included), and the red points the Crawford et al. model. The small and large points represent fine and coarse bin sizes, respectively, and the lines are polynomial fits to the small points. Numbers at the top of the plot show numbers of data points in each surface area density bin.
ARS Figure 2: Same as ARS Figure 1 above, but for cloud liquid water content. Black dashed line shows relative volume of liquid water. (Cantrell et al., J. Geophys. Res., 2003)
The ARS group (Chris Cantrell) concentrated its efforts this year on laboratory characterizations and improvements to the PerCIMS (Peroxy Radical Chemical Ionization Mass Spectrometer) instrument, and publication of results including a description of the instrument (Edwards et al., Analytical Chemistry, 2003), and an analysis of observations made during TRACE-P (Cantrell et al., JGR-Atmospheres, 2003). Gavin Edwards, a post-doctoral scholar in the group, completed his stay at NCAR and accepted a position at Purdue, starting in June, where he works with Paul Shepson. Project leader Christopher Cantrell accepted a temporary assignment, starting in August 2003, as Associate Director for the Division of Atmospheric Sciences (ATM) in the Directorate for the Geosciences (GEO) at the National Science Foundation.
The instrument characterization and improvement studies carried out since the middle of FY01, have led to an improved understanding of the response of PerCIMS to a variety of peroxy radical types (RO2 radicals), the detailed response of the instrument as functions of water vapor concentration, ambient pressure and reagent gas concentration, and the development of mathematical descriptions that satisfactorily reproduce the laboratory observations. PerCIMS is based on the conversion of ambient peroxy radicals to gas-phase sulfuric acid (H2SO4) from the chain oxidation of NO and SO2 that are added. Chain lengths of 2-10 are typically achieved through the addition of about 5 ppmv NO and 300 ppmv SO2. The instrument response peaks at an NO concentration that depends on the reaction time, while the concentration increases almost linearly with SO2 concentration. The relationship between the sulfuric acid yield per peroxy radical ([H2SO4]/[HO2]o) and the reagent gas concentrations, the reaction time and the rate coefficients for the relevant reactions is given in the following equation.
![]()
Where
![]() (19)
(19)
Where the k-values are rate coefficients for the important reactions (see below), brackets ([]) represent species concentrations, and t is the reaction time. At completion, the yield of H2SO4 per peroxy radical is proportional to the SO2 concentration and inversely proportional to the NO concentration. The inlet chemical reactions follow.
HO2 + NO ® OH + NO2 (11)
OH + SO2 + M ® HSO3 + M (14)
OH + NO + M ® HONO + M (17)
The HSO3 species produced in reaction (14) rapidly reacts with molecular oxygen (O2) to produce SO3 and HO2. The SO3 then reacts with water vapor leading to H2SO4 (discussed later). When RO2 radicals are sampled, additional chemistry must be considered.
RO2 + NO ® RO + NO2 (20)
RO2 + NO + M ® RONO2 + M (21)
RO + O2 ® R’CHO + HO2 (22)
RO + NO + M ® RONO + M (23)
RO2 radicals that form HO2 (reaction 22) are measured by PerCIMS, whereas the formation of nitrates and nitrites (reactions 21 and 23) inhibits their measurement. The competition for alkoxy radicals between O2 and NO (reactions 22 and 23) may be controlled by adjusting the ratio of their concentrations. If the rate of reaction with O2 is dominant, then the radicals are measured with high efficiency; but if the rate of reaction with NO is fast, then they are measured with low efficiency. This relative measurement efficiency (relative to HO2) was measured as a function of [NO]/[O2] in the laboratory for CH3O2 radicals. The response was found to be high at low NO concentrations (5 ppmv or less) and gradually dropped at higher NO concentrations, reaching a plateau at about 15% for NO concentrations greater than 500 ppmv. Our first mathematical model of this response agreed at low and middle NO concentrations, but near-zero yield at high amounts. It was found through a series of experiments that a process involving the reaction of CH3O radicals with SO2 leading to H2SO4 was operative (analogous to reaction 14) that limited the scavenging of RO radicals by NO. The response of a series of peroxy radicals derived from alkanes, alkenes, aromatics and oxygenated hydrocarbons was studied for low and high reagent concentrations. Our mathematical model satisfactorily (within 10-15%) reproduced the laboratory measurements, which is particularly encouraging given significant uncertainties in the rate coefficients for some of the processes.
Loss of radical species to the inlet walls was also incorporated into the model and found to be relatively insignificant. The conversion of peroxy radicals to H2SO4 is only part of the process of their measurement with PerCIMS. In a separate part of the inlet, the H2SO4 product is chemi-
ionized by reaction with NO3 ions, leading to HSO4 ions. The nitrate reagent ions are produced by passing a mixture of HNO3 in air (about 20 ppmv) over a radioactive foil (usually Americium-241). The product and reagent ions are separated from air and reagent gases by passage through a dry nitrogen buffer flow before entry into the mass spectrometer vacuum system. There, the ions are directed, via a series of electrostatic lenses, through two stages of differential pumping into a quadrupole mass filter, from which the ions exit into a channel electron multiplier detector operating in the negative ion mode.
The PerCIMS instrument is calibrated using the 184.9 nm photolysis of water vapor. The mercury lamp intensity – photolysis time product is determined using N2O actinometry, which is a novel approach. A detailed propagation of errors analysis was performed that identified sources of error in the instrument calibration and atmospheric measurement.
Using a specially-designed apparatus, calibrations were performed as a function of ambient pressure between about 200 and 760 Torr. The purpose is to assess whether calibrations performed on the ground are applicable to observations at higher altitudes, and whether these changes can be understood. The changes are observable, but not too large (10-30%), and can be accounted for in the data reduction procedures. Finally, the response as a function of water vapor was measured (at room temperature) from 100% relative humidity down to very low levels (about 100 ppmv). A slight reduction in sensitivity was noted at the lowest water concentrations due to the rate of reaction between SO3 and water vapor being slow enough so as to fail to proceed to completion. We reasoned that in the atmosphere the lowest water concentrations are usually accompanied by lower temperatures, and since the kinetics of this reaction are such that it is faster at lower temperatures, allowed some compensation for the lower water concentration. We estimated that the instrument will perform satisfactorily in the cold, dry upper troposphere to water concentrations of 10 ppmv or less.
Measurements from synthetic sources and the ambient atmosphere were made near State College, Pennsylvania alongside the Laser Induced Fluorescence (LIF)-based instrument of Bill Brune. The comparison was quite good (with some differences not fully understood) and the first results published in a paper by Ren et al. (JGR-Atmospheres).
The Transport and Chemical Evolution over the Pacific (TRACE-P) campaign was conducted in the spring of 2001. Subsequent analysis of the data collected with PerCIMS along with other data collected has revealed an interesting story. For most of the conditions that the NASA P-3B aircraft flew, the peroxy radical concentrations can be reproduced satisfactorily by a simple, constrained, steady state model. Where measurement-model differences do exist, they can often be interpreted due to uptake of radicals by aerosols or cloud droplets. There are apparent differences at high NO concentrations (also observed by other researchers) that are not currently understood.
Measurements, Standards, and Intercomparisons Group
The Measurements, Standards, and Intercomparisons (MSI) Group (Eric Apel) contributes to understanding of biogeochemical cycling, atmospheric trace gases and tropospheric photooxidants.
MSI Highlights
The MSI Group designed a Fast-GC/MS (FGCMS) system to measure C2 to C4 carbonyls and methanol (OVOCs) aboard aircraft (Apel et al., JGR., 2003) This year the instrument has been dramatically improved so that it is now capable of measuring more than 40 compounds (previously it measured 7) including chlorofluorocarbons (CFCs) and non-methane hydrocarbons (NMHCs) as well as oxygenated volatile organic compounds (OVOCs) in a shorter period of time. The instrument is a key addition to ACD’s measurement capability. During this year, the instrument was integrated and deployed on the NCAR C-130 during the NCAR-sponsored Instrumentation Development and Education in Airborne Science (IDEAS) II program. Part of the motivation for participating in IDEAS was in anticipation of potential deployment during the Megacity Impacts on Regional and Global Environments (MIRAGE) campaign.
Data collected with the instrument during the last two years was analyzed and partially interpreted. MSI Figure 1 shows the FGCMS box and whisker plot of vertical profiles from data taken by the FGCMS over the Pacific Ocean during the NASA-sponsored Transport and Atmospheric Chemistry near the Equator (TRACE-P) program. TRACE-P was designed to measure the outflow and evolution of the outflow of pollution from Asia as it proceeds across the Pacific. The edges of the box are the 25th and 75th percentiles and the edges of the whisker line represent the 10th and 90th percentiles. The median value is represented as a solid line. The tropospheric vertical profiles of propanal, butanal, and methyl ethyl ketone are the first to be reported in the literature. The aldehydes and methyl ethyl ketone show distinct profile trends with decreasing mixing ratios with altitude; these profiles would be expected of a shorter-lived compounds with higher surface or near-surface sources. Methanol and acetone profiles show less variability with altitude than the aldehydes, as might be expected from these longer-lived compounds. In contrast with the aldehydes, the methanol mixing ratio decreases at lower altitudes perhaps indicating that the ocean may be a sink for methanol. It is also likely that the data will discern whether the mid-latitude Pacific Ocean is a sink or source of acetone as well, once low-level air-pollution events are accounted for. Model-calculated sensitivity of OH to oxygenated hydrocarbons from the Group’s measurements (MSI Figure 2) show that acetone potentially plays a very important role in tropospheric oxidation mechanisms above eight kilometers. This has important implications for the proposed Upper Troposphere, Lower Stratosphere (UTLS) initiative.
Large variations in mixing ratios of all compounds were observed during TRACE-P, because polluted layers and biomass burning plumes were specifically targeted. This paper presents key data on the atmospheric budgets of little-measured but potentially very important species and also points out that there are large discrepancies between the models and measurements. These discrepancies are particularly strong for acetaldehyde, as artifacts for aldehydes are easily formed, and that experimentalists must be very careful to ensure that their instruments are artifact-free before rigorous comparisons are made with models.
OVOCs are important constituents of the troposphere because of their role in key oxidation cycles. Currently, information on atmospheric distributions of these compounds is limited because ground-based measurements have only receontly become common, and relatively few measurements have been recorded on aircraft platforms. More complete data on the distribution, sources, and sinks of this compound class will ultimately lead to a better understanding of atmospheric chemistry through improved models that explicitly take into account contributions of these species to the photooxidation mechanisms at work in the troposphere.
The FGCMS instrument was originally developed for deployment during the NASA Global Tropospheric Experiment (GTE) TRACE-P mission. It is now an important ACD asset. The system as it is now configured consists of four major components: sample inlet, preconcentration system, gas chromatograph (GC), and detector. The preconcentration system is a custom-built cryogen-conservative system. The GC is a compact, custom-built unit that can be temperature programmed and rapidly cooled. Detection is accomplished with an Agilent Technologies 5973 mass spectrometer. The FGCMS instrument provides positive identification because the compounds are chromatographically separated and mass selected. During TRACE-P, a sample was analyzed every 5 minutes. During IDEAS a sample was analyzed every 4.1 minutes. During TRACE-P the FGCMS limit of detection was between 5 and 75 pptv, depending on the compound. This year the limit of detection for the instrument has been improved to between 1 and 35 pptv. Methods have been refined for producing highly accurate gas phase standards for target compounds and for testing the system in the presence of potential interferents. These methods are being made available to the research community.
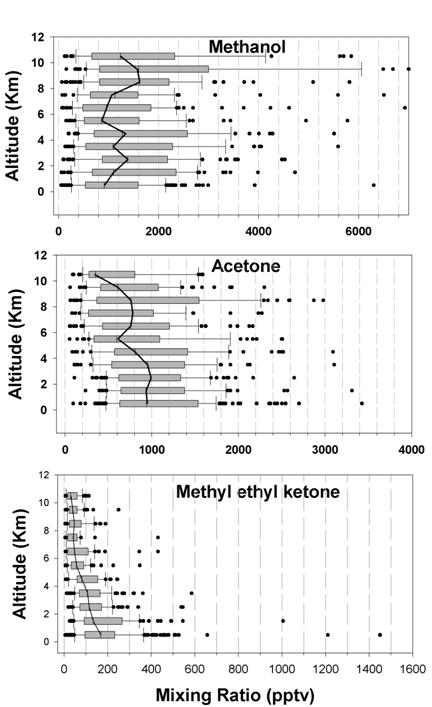
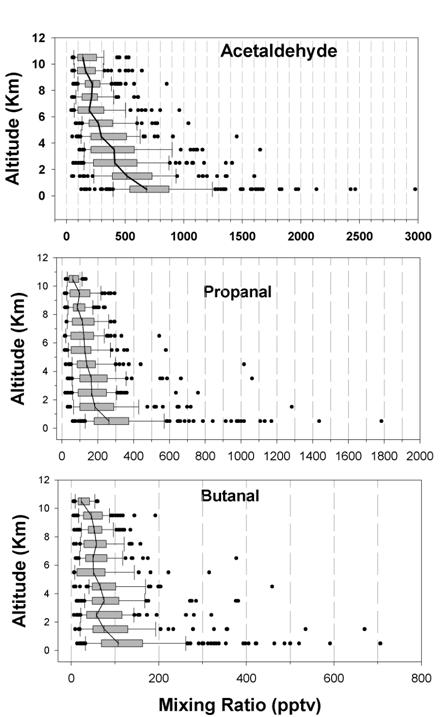
MSI Figure 1: TRACE-P FGCMS entire data set, box and whisker plot of vertical profiles for methanol, acetone, methyl ethyl ketone, acetaldehyde, propanal, and butanal. The edges of the box are the 25th and 75th percentiles and the edges of the whisker line represent the 10th and 90th percentiles. The median value is represented as a solid line.
 |
MSI Figure 2: Box model calculated sensitivity of OH to oxygenated volatile organic compounds measured by FGCMS during TRACE-P. Left panel shows all values; the right panel, median values.
The NOn Methane Hydrocarbon InterComparison Experiment (NOMHICE) was designed to assess the accuracy and comparability of non-methane hydrocarbon (NMHC) measurements from research groups around the globe. This is being accomplished by conducting a series of intercomparisons, called Tasks, of prepared mixtures or collected ambient air. Apel et al.’s The Non-Methane Hydrocarbon Intercomparison Experiment (NOMHICE): Task 4, J. Geophys. Res., vol. 108, NO. D9, 4300, 2003, on the international non-Methane Hydrocarbon Intercomparison Experiment, presented results for an ambient air challenge sample as part of the fourth NOMHICE installment (Task 4). Individual analyses from participant laboratories throughout the world were compared and ranked with respect to agreement with the reference values; the ranking was reconciled with the analytical procedures employed for each analysis. From this, recommendations were derived for preferred analytical techniques and practice. Recommendations for NMHC analyses include, but are not limited to, the following: (1) National Institute of Standards and Technology (NIST) standards or NIST-traceable standards should be used and, for mass spectrometric analyses, multi-component NIST-traceable standards should be used, (2) if solid adsorbents are used for preconcentrating NMHCs, extensive tests should be performed to test for artifact formation and compound losses, and (3) for whole air sampling in canisters, subsequent analyses should be performed as soon as is reasonably possible to avoid the potential for compositional changes.
Twenty-three laboratories participated in Task 4 and 30 overall analytical results are compared. The air sample provided a wide dynamic range of mixing ratios (parts per trillion by volume (pptv) – parts per billion by volume (ppbv)) as well as large number of compounds (> 100). Co-elutions of NMHCs with other volatile organic compounds (VOCs) such as oxygenated VOCs are shown to make the analysis of whole air samples more challenging than for prepared standard mixtures. Individual canisters containing the air sample were prepared and analyzed by the NOMHICE group at the National Center for Atmospheric Research (NCAR-NOMHICE), sent to participants for analysis, and reanalyzed upon return to NCAR-NOMHICE. The mixing ratio of propylene increased by 10% (14 pptv) in the canisters with time and some of the less volatile compounds decreased in the canisters with time but the majority of the compounds were stable throughout the experiment. Participants were asked to identify and quantify as many compounds as possible with their analytical techniques and to submit their results to NCAR-NOMHICE scientists. Fifty-four compounds were chosen for the intercomparison. Eight hundred eighty three measurements were compared overall; the average of the mean ratios of the participants’ results to NCAR-NOMHICE results was 1.03. The participants’ results were combined and averaged for each individual NMHC measured and compared to the reference results; thirty-three of the 54 compounds agreed to within ± 20% of the reference results. These results are shown in MSI Figure 3. Individual analyses from participant laboratories were compared and ranked with respect to agreement with the NCAR-APEL reference values. These data are shown in MSI Figure 4. The ranking was reconciled with the analytical procedures employed for each analysis. From these results, recommendations were derived for preferred analytical techniques and practice so that measurements worldwide may be comparable and harmonized to a much greater extent.
We continue to have close collaborations with many of the institutions listed below even though the intensive experimental portion of this program has been completed. We are in the process of manuscript preparation for other NOMHICE activities, including Task 5 and experiments more recently conducted during field studies in the United States.
|
Participating Institutions in Task 4 |
|
|
Institution |
Country |
|
Air Monitoring Unit, Ministry of Environment and Energy |
Canada |
|
Air Pollution Laboratory, Institute of Applied Environmental Research, Stockholm University |
Sweden |
|
Atmospheric Environment Service, Downsview, Ontario |
Canada |
|
Atmospheric Sciences Research Center, University of Albany, State University of New York |
United States |
|
Center for Research Atmospheric Chemistry, York University |
Canada |
|
Department of Chemistry, University of California, Irvine |
United States |
|
Department of Technical Physics, Peking University |
Peoples Republic of China |
|
Desert Research Institute, Reno, NV |
United States |
|
Engineering Science College, Harvard University |
United States |
|
Environment Institute ISPRA Establishment |
Italy |
|
Fraunhofer Institute for Atmospheric Environmental Research |
Germany |
|
Institute für Atmospharische Chemie, Forschungszentrum Julich |
Germany |
|
Institute of Environmental and Biological Sciences, Lancaster University |
United Kingdom |
|
Institute of Environmental Sciences, TNO Division of Technology for Society |
Netherlands |
|
Monitoring & Laboratory Division, California Air Resources Board |
United States |
|
National Institute of Water and Atmospheric Research, Ltd. |
New Zealand |
|
Pollution Measurement Center, Environment Canada Technical Center |
Canada |
|
Radian Corporation, Austin, TX |
United States |
|
RIVM Research for Man and Environment |
Netherlands |
|
School of Environmental Sciences, University of East Anglia |
United Kingdom |
|
Swedish Environmental Research Institute |
Sweden |
|
Texas Natural Resource Conservation Commission, Austin, TX |
United States |
|
Department of Civil and Environmental Engineering, Washington State University |
United States |
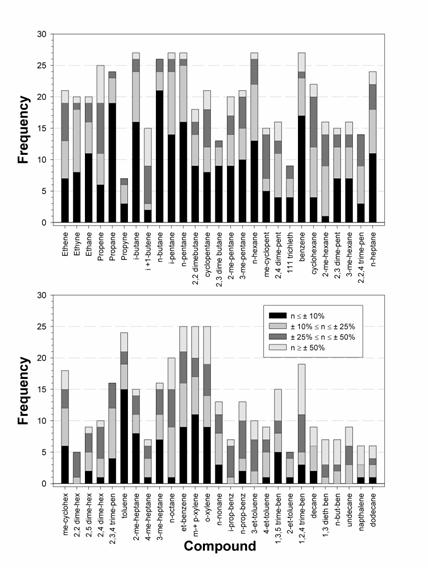
MSI Figure 3: Stacked-bar chart showing the combined participant analytical results observed for each compound. The breakdown is shown of the number of occurrences of participant results falling within the given limits, i.e., ± 10%, ± 10% to ± 25%, ± 25% to ± 50%, and ³ ± 50%, of the reference results.
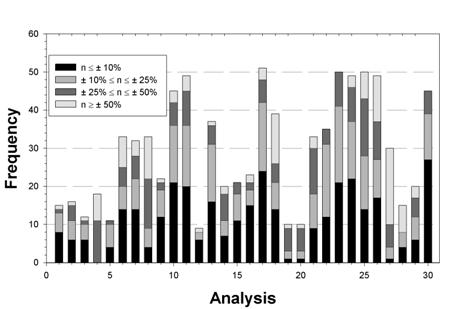
MSI Figure 4: Stacked-bar chart showing the analytical results observed for each participant analysis (there are 30 analyses and only 23 participants because some laboratories performed more than one analysis). The total number of intercompared NMHCs measured is shown by the full bar and the number of NMHCs measured to within given brackets of the reference results, i.e., ± 10%, ± 10% to ± 25%, ± 25% to ± 50%, and ³ ± 50%, is shown within the bar by the code described in the legend.
This year the MSI Group hosted two Broomfield High Students, Sara Herold and Nicole Apel. The title of their project was: “The Regional Effect of the Hayman Fire on Air Composition: Implications for Air Quality.” The students were trained to measure volatile organic compounds (VOCs) in the laboratory. MSI Figure 5 shows the students collecting whole air samples during the Hayman fire. MSI Figure 6 shows a photograph of the Front Range as seen from NCAR during the fire. They found enhanced levels of a number of VOC species, for example, acetone and methanol, during several events in which the plume passed near their sample collection point at NCAR. They reported on their findings at the annual Colorado-Wyoming Junior Academy of Science meeting and placed 3rd for their outstanding work. Following is a picture of the students collecting samples and a picture of the haze observed during an “event” in which the NCAR Mesa site was impacted by the fire.
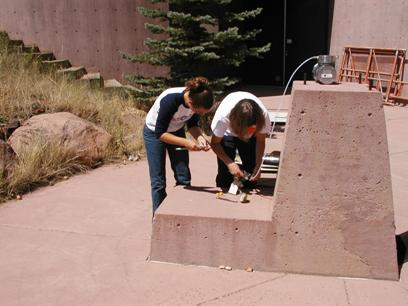
MSI Figure 5: Broomfield High Students collecting samples for the Hayman Fire Study
MSI Figure 6: Photograph of Front Range as seen from NCAR during the Hayman fire
Biosphere-Atmosphere Interactions Group
The mission of the Biosphere-Atmosphere Interactions (BAI) Group is to advance understanding of the role of biosphere-atmosphere interactions in the Earth system and to predict the response to human perturbations. This is being accomplished through multidisciplinary field, laboratory, and modeling studies of the processes controlling these interactions on various scales (e.g., leaf to canopy to landscape to global). BAI members include Alex Guenther, James Greenberg, Peter Harley, Thomas Karl, Ryan Schnell, Andrew Turnipseed, and Christine Wiedinmyer. ASP postdoctoral scientists working closely with the BAI group include Sreela Nandi, Mark Potosnak, and Craig Stroud.
Significant accomplishments for FY03 include observations of whole canopy exchange and chemistry in tropical and temperate forests that demonstrate that canopy uptake rates are much higher than previously thought for important tropospheric trace gases including PAN, isoprene, methanol, acetone, and acetaldehyde.
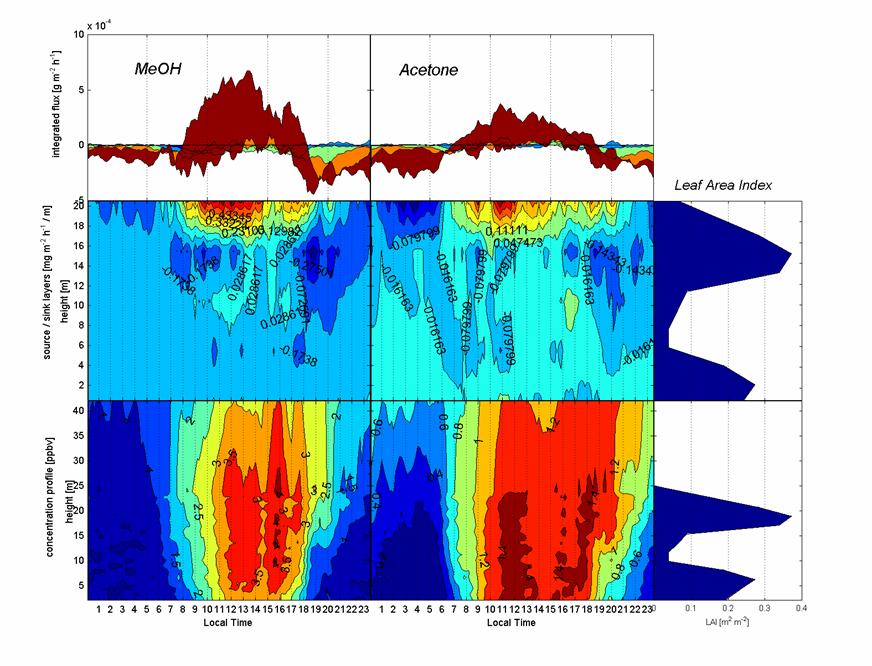
BAI Figure 1: Methanol and acetone above canopy net fluxes (top panels) and vertical profiles of source/sink rates (middle panels) and concentrations (bottom panels) observed by NCAR-ACD scientists in May 2003 within and above a tropical rainforest canopy in Costa Rica. The observations demonstrate that the forest acts as both a major source and a major sink of these compounds.
The Chemical Emission, Loss, Transformation and Interactions within Canopies (CELTIC) study was conducted from June 30 to July 25, 2003, at the Duke Forest FACTS-1 Site. The primary objective of CELTIC is to improve our ability to predict regional air quality (e.g., particulates and ozone) and climate through a quantitative understanding of the processes controlling the exchange of trace gases and aerosols between the atmosphere and vegetation canopies. CELTIC participants included William Bradley, Guenther, Greenberg, Harley, Karl, Monica Madronich, Sasha Madronich, Sou Matsunaga, Eiko Nemitz, Ryan Schnell, Nandi, Potosnak, Stroud, and Turnipseed (all NCAR-ACD), Chris Geron, Robert Arnts, John Walker (USEPA), Jose Jimenez, Darin Toohey, Alice Delia (all University Colorado), Jed Sparks (Cornell), Greg Huey (Georgia Tech), Kolby Jardine and Brad Baker (SDSMT), Jose Fuentes (U. of Virginia) Will Vizuete (U. of Texas), Fred Mowry and Jeff Herrick (Duke University), Francesca Rapparini (Istituto di Biometeorologia, Italy), Rei Rasmussen (Oregon Graduate Institute). CELTIC researchers used an unprecedented array of enclosure and whole canopy trace gas and aerosol measurement systems to compile a unique database that is being used to develop and evaluate models of biosphere-atmosphere chemical exchange. Analytical systems included twelve real-time, fast-response and continuous analyzers capable of quantifying key trace gases (>10 VOC species, NH3, PANs, NOy, CO2) and CCN and total particle numbers and chemical composition. The measurements demonstrate that our current understanding of the controlling biological, chemical and physical factors is limited and that current models are not able to accurately simulate observed biosphere-atmosphere exchange of trace gases and particles.
Leaf, branch and soil enclosure systems characterized the response of isoprene, monoterpenes, sesquiterpenes, oxygenated VOC, ozone and NOx emission and uptake to changes in chemical (e.g., ozone and CO2) and physical (e.g., temperature, light, soil moisture) conditions. Major findings include observations that 1) isoprene emission increases with elevated ozone, 2) canopy scale isoprene emission increases with elevated CO2, 3) soil and leaf litter are a net sink of oxygenated VOC, and 4) sesquiterpene emissions may be higher than monoterpene emissions under certain environmental conditions.
Above canopy fluxes and within canopy vertical profiling systems characterized variations in trace gases (isoprene, monoterpenes, oxygenated VOC, NOx, ozone, CO2, PANs, NH3), particles (numbers, size distribution, chemical composition, CCN) and physical environment (JNO2, UV-B, photosynthetically active radiation [PAR], temperature, humidity, winds, turbulence). The results include the first above canopy flux measurements of PANs and the chemical components of particles.
The BAI group investigated trace gas exchange at field studies in tropical landscapes in China (Guenther and Greenberg), Brazil (Guenther and Potosnak) and Costa Rica (Karl, Potosnak, and Guenther) during FY03. The results show that biogenic VOC emissions have strong seasonal variations and that the prevalent land-use changes in tropical regions are likely to result in substantial changes in the chemical composition of the atmosphere.
ACD visitor, Teresa Nunes (Universidad Aveiro) worked with Harley, Greenberg, and Guenther to investigate the influence of drought and long term temperature variations on monoterpene emissions in the NCAR FLUXTRON in FY03. Monoterpene emissions increased substantially in response to mild drought.
Guenther, Wiedinmyer, Harley, and Karl improved the Model of the Exchange of Gases between the Atmosphere and Nature (MEGAN) model which predicts regional and global emission estimates of isoprene, methanol, acetone, acetaldehyde and other emissions during FY03.
Wiedinmyer has continued development of an international biogenic VOC measurement database during FY03 in collaboration with Guenther, Harley, Geron (USEPA), Rei Rassmussen (Oregon Graduate Center) and Nick Hewitt (Lancaster University). The database is described in detail, and available on-line, at bvoc.acd.ucar.edu.
The BAI group FY03 instrument developers (Nemitz, Turnipseed, Greenberg, and Guenther) completed a Chemical Ionization Mass Spectrometer (CIMS) system that is intended for measuring ammonia fluxes (in collaboration with Dave Hansen, Fred Eisele, John Walker [USEPA]), a disjunct eddy accumulator (in collaboration with Brian Lamb [Washington State University] and Paul Shepson [Purdue]), and aerosol flux systems (in collaboration with Brad Baker [SDSMT] and Roelof Bruintjes [RAP]). The good performance of each system was demonstrated during the 2003 CELTIC study.
Stratospheric/Tropospheric Measurements Group
The Stratospheric/Tropospheric Measurements (STM) group (Elliot Atlas, Frank Flocke, Sue Schauffler, Stephen Donnelly, Verity Stroud, Amy Lueb) investigates the sources, budgets, distribution and variations of atmospheric trace gases, with particular emphasis on those species related to the ozone formation and destruction processes in both the troposphere and the stratosphere. Research investigations related to peroxyacetyl nitrate distributions and chemistry are conducted jointly with the Atmospheric Odd-Nitrogen (AON) group (Brian Ridley, Andrew Weinheimer) in ACD. Additional collaborations are described in the following narrative. An integral part of the STM program is to evaluate and develop state-of-the-art sampling and analytical facilities for trace gas measurement from different environments. The STM group has been active in both field and laboratory investigations during the past several years. Analysis of the results of these investigations has continued in FY03, and some findings are highlighted in this report. A review of accomplishments in major field deployments and other projects is presented first.
The ITCT project is a research activity of the International Global Atmospheric Chemistry (IGAC) Program that directly addresses the tropospheric chemistry and transport of ozone, fine particles and other chemically-active greenhouse compounds (http://www.al.noaa.gov/WWWHD/Pubdocs/ITCT/2k2/). Scientists at the NOAA Aeronomy Laboratory (Fred Fehsenfeld, Michael Trainer, David Parrish, Gerd Hübler) were the primary organizers and planners of the ITCT activity, and NOAA provided partial support for STM participation. Briefly, the ITCT activity is aimed at understanding the long-range (intercontinental) transport of ozone and aerosols and the impact that this intercontinental transport has on regional climate and air-quality. The first field campaign was in April/May 2002 (ITCT 2k2) and it focused on the influence of Asian outflow on the U.S. west coast, on emissions from west coast urban centers and ship traffic, and on characterization of the atmospheric chemistry of the eastern North Pacific troposphere. The campaign included NOAA P3 aircraft flights out of Monterey, California and ground based measurements from Trinidad Head, California. STM measurements were exclusively from the aircraft platform, and measurements included PAN and related peroxyacyl nitrates (using an automated PAN gas chromatograph) and also a suite of trace gases from whole air sample collection. Whole air samples were collected for analysis of a variety of organic trace gases, including methane, NMHC, halocarbons, organic nitrates, and selected sulfur species. Mission flight tracks were designed to examine regions characteristic of the background atmosphere, and regions impacted by specific point sources, larger urban sources, and long-range transport.
Measurements from whole air samples are being used to characterize the background atmosphere of the eastern North Pacific, to define chemical emissions from the west coast urban areas and to identify signatures of long-range trans-Pacific transport that impact the U.S. west coast. Manuscripts led by Jost deGouw (NOAA Aeronomy Laboratory) and John Nowak (NOAA Aeronomy Laboratory) have been prepared that combine trajectory analyses with the whole air trace gas measurements with gas and aerosol measurements from other airborne instruments to show the presence of air masses transported from the Asian continent. Interestingly, in one case, tracers could distinguish the difference between two adjacent air masses that had undergone long-range transport from the Asian continent. A combination of C2-C5 NMHC and other tracers (e.g. CH3Cl and CH3CN (measured by PTR-MS)) could show that the sources of the two air masses were quite distinct, though they were found to be physically close in altitude over the US West Coast. The lower layer could be distinguished as an urban air mass from a characteristic hydrocarbon pattern. The upper layer was clearly of biomass burning origin, and had a source further west in the Asian continent.
Data from the NASA TRACE-P experiment conducted February to April, 2001 were analyzed in FY02, and these analyses focused on the influence of Asian pollution outflow on the tropospheric chemistry over the central and western Pacific Ocean. The campaign included 20 flights, covering the Western Pacific from about 10°N to 40°N latitude. Two aircraft were deployed, the NASA DC-8 and the NASA P-3. STM contributed two projects to the TRACE-P mission. These were trace gas analyses from whole air samples and in-situ analysis of PANs.
Selected highlights were reported last year, and data analysis has continued. A manuscript led by N. Blake (UCI) compares the relative emissions and distributions of the sulfur species, CS2 and OCS, associated with different regions of the Asian continent. The manuscript uses data from the whole air samples and new emissions estimates for sulfur species to examine the characteristics of Asian outflow to the Pacific atmosphere (see STM Figure 1). In general, there was an enhanced emission of sulfur species associated with the Asian outflow that appears to be common. Further, while data are in reasonable agreement with new emission inventories for some parts of the region, the emissions from China are considerably underestimated, perhaps because of an underestimate associated with coal combustion.
STM Figure 1: Carbonyl Sulfide distribution measured from whole air samples collected during TRACE P
Studies of the historical trend of tropospheric trace gases have continued in collaboration with William Sturges (University of East Anglia, UK), Jerome Chappellaz (Centre National de la Recherche Scientifique [CNRS], France), Jakob Schwander (University of Berne), James Butler and Steven Montzka (NOAA CMDL, Boulder). Historical trends are inferred from trace gas profiles trapped in firn air in polar regions. Depending on the rate of snow accumulation and the depth of the “close-off” layer (where porous firn becomes solid ice), trace gases from the early to mid-20th century may be sampled. Earlier studies by the STM Group and colleagues included data for NMHC from 2 firn cores in the Northern Hemisphere (Devon Island, Canada and NGRIP, Greenland) and several Antarctic firn cores (including S. Pole). As expected from contemporary distributions of NMHC, significantly higher levels of NMHC are found in the Northern Hemispheric samples compared to the Southern Hemisphere. This past year, additional measurements from the Antarctic (Berkner Island) were made and these data provided a more complete firn profile of NMHC than was obtained in earlier sampling. The data show a similar pattern to that observed in the other Antarctic samples.
In collaboration with scientists from the Kiel Institute for Marine Studies (Birgit Quack and Doug Wallace), the University of East Anglia (Adele Chuck), the Max Planck Institute (Jonathan Williams), and NOAA CMDL (Jim Butler and Steve Montzka), the STM group measured a variety of NMHC, halocarbons and organic nitrates from whole air samples collected along a transect from S. America to Africa around 10 N. The data show a complex distribution reflecting interhemispheric transport, biomass burning effluents, and evidence of transport of industrial emissions from the European continent to the tropical Atlantic. Atmospheric measurements are currently being integrated with near simultaneous trace gas measurements in surface waters to estimate air-sea fluxes of reactive species (esp. bromine containing organics and alkyl nitrates).
STM has designed and tested a new cryogenic whole air sampler for use on balloon (and possibly airborne) platforms. The instrument is designed to obtain a high resolution profile of stratospheric trace gases to better understand stratospheric transport and trends in constituents (e.g. hydrochlorofluorocarbons, perfluorocarbons, etc.) at altitudes beyond that accessible even with high-altitude aircraft. A mechanical/engineering test flight of the new CWAS was flown from Ft. Sumner, New Mexico. The instrument is ultimately designed to house two dewars that contain 26 sample tubes each. Each sample tube (0.7 l) can collect up to 12 – 15 standard liters of air. On this first flight, one dewar was tested and a profile of trace gases from approximately 10 km to >33km was obtained (about one sample/km). Trace gas measurements from this profile are underway, and after the chemical tests, selected samples will be shared with colleagues (e.g. Kristie Boering, University of California at Berkeley; Stan Tyler, University of California at Irvine; Paul Wennberg, Cal Tech; and others) to measure the isotopic composition and variation of trace gases in the stratosphere.
The HIgh Resolution Dynamics Limb Sounder
The HIgh Resolution Dynamics Limb Sounder (HIRDLS) is a 21 channel infrared limb scanning radiometer being jointly developed by the U.S., led by the University of Colorado and NCAR, and the U.K., led by Oxford University. The NCAR/ACD team includes Byron Boville, Charles Cavanaugh, Michael Coffey, Cheryl Craig, Thomas Eden, David Edwards, Gene Francis, John Gille, Prog Mgr, Chris Halvorson, Rashid Khosravi, Douglas Kinnison, Alyn Lambert, Hyunah Lee, Julia Lee-Taylor, Lawrence Lyjak, William Mankin, Steve Massie, Bruno Nardi, Daniel Packman, William Randel, Barbara Tunison. The CU/ACD team includes Phillip Arter (deceased), Linnea Avallone, Susan Avery, Dan Baker, James Craft, Randal Davis, Vincent Dean, Michael Dials, John Gille, Linda Henderson, Charles Krinsky, Patrick Kruse, Tom Lauren, Aaron Lee, Joanne Loh, Bill McClintock, Joseph McInerney, Brent Peterson, Cora Randall, David Rusch, Kenneth Stone, (Owen) Brian Toon, Brendan Torpey, Lynn Walloch, Angie Williams, David Wilson, Douglas Woodard, Greg Young.
The instrument has been designed to achieve higher vertical (~ 1 km) and horizontal (5° latitude by 5° longitude) resolution than that previously available, over the altitude range from 8-80 km. Quantities to be measured include temperature, ozone, water vapor, methane, nitrous oxide, nitrogen dioxide, dinitrogen pentoxide, nitric acid, CFC 11 & 12, chlorine nitrate and aerosol properties. HIRDLS is scheduled to be launched on the Aura spacecraft during the first half of 2004.
Calibration of the HIRDLS flight instrument at Oxford University was beginning at the start of this reporting period. Under intense schedule pressure, the international science team, led by John Gille (U.S. Principal Investigator, ACD and University of Colorado) and John Barnett (United Kingdom Principal Investigator, Oxford University) worked 24 hours a day, 7 days a week, to acquire data to determine the radiometric, spectral, and spatial responses of the instrument. The calibration had to be performed in a vacuum tank to achieve the high accuracy required. Rapid completion of the work was only possible because of work over several years by the Oxford team of Barnett, Christopher Hepplewhite, John Whitney, Christopher Palmer, Robert Watkins and Joseph Moorhouse, with major support from Arter to develop test apparatus that could operate unattended, under computer control, for long periods. Eden, Nardi, Coffey, Mankin and Gille spent extended periods in Oxford, along with A. Lee, .Woodard, Dials, and Arter, obtaining and performing preliminary analyses of the resulting data. In the end, a large amount of excellent data was obtained to characterize instrument performance. This was done in a period of only 3.5 months, much shorter than the previously planned minimum period of 4.5 month. A formal review of the process and the data was held in late November, resulting in formal approval to ship the instrument to spacecraft integration. Detailed analysis of the calibration data is continuing.
The HIRDLS instrument (shown in HIRDLS Figure 1) was delivered to Northrop Grumman (then TRW) in Redondo Beach, California in early December. By mid-January it had been mechanically and electrically integrated with the spacecraft to begin a year of testing (HIRDLS Figure 2). After the vibration and acoustic testing, the radiometric noise was found to have increased so that several channels no longer met their specifications. This was traced to an interaction between the cooler and the chopper, and the discovery that a short circuit had developed in the cooler. A quick change to some circuitry has brought the radiometric noise back to the initial levels, although the cooler may be putting out more vibration than previously. The spacecraft is in thermal vacuum (T/V) testing at the end of the period. Further evaluation will take place after the T/V testing.
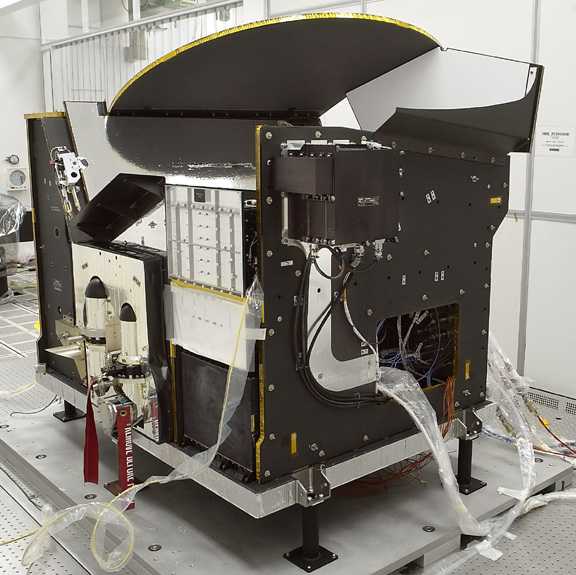 |
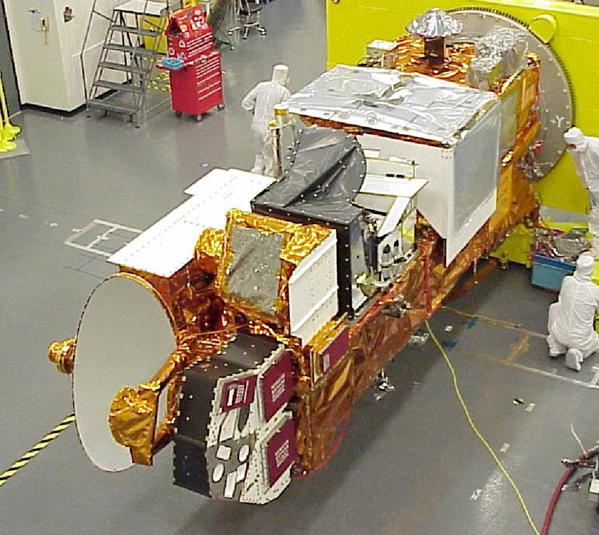
HIRDLS Figure 2: HIRDLS integrated on the Aura spacecraft. HIRDLS is the instrument
with the black multi-layer insulation in the center of the picture.
Preparations for Early Orbit Operations
HIRDLS is an extremely complex instrument, requiring a large number of commands to control the 9 subsystems and numerous sub-assemblies with moving parts or parameters with settable parameters. Craft and Williams developed procedures to allow the instrument to be commanded in orbit, for nominal conditions as well as a set of anomalous conditions. These procedures were run on simulators, and subsequently have been run in several ground tests of the ability to command HIRDLS through the Aura spacecraft and the NASA control center at Goddard Space Flight Center. In addition, extensive planning for the launch and early orbit activation has taken place, and command sequences have been practiced.
Lambert, H. Lee, and Khosravi have continued development of the HIRDLS retrieval algorithms, with the anticipation of the production of a flight-ready operational processing scheme early next fiscal year. The retrieval algorithms are described in the Level-2 Algorithm Theoretical Basis Document and are now undergoing final pre-launch testing, including incorporation of the calibration data parameters measured at Oxford. Further work this year has advanced the characterization of the inversion method and contributed to producing diagnostic information essential to understanding the retrieval process and provided a framework for identifying post-launch problems.
The characteristic long atmospheric path of infrared limb sounders can lead to biases in the retrieval of temperature and chemical species because of the existence of gradients along the line-of-sight. Lambert has implemented a line of sight correction algorithm, and verified it from comprehensive retrievals of the entire HIRDLS data product set using simulated radiances generated from 12 hours of Mozart 3 output. The HIRDLS temperatures are improved significantly, removing a bias of up to 3K in regions of large temperature gradients. In addition to benefiting from the temperature retrieval improvement, HIRDLS chemical species products are also improved in regions of large chemical gradients. This is shown in HIRDLS Figure 3.
Satellite observations of aerosols and clouds are very important for understanding atmospheric chemistry, dynamics, and radiation. In the infrared region, the presence of aerosols interferes with gas retrievals in all channels, and the large increase in the observed radiation induced by clouds makes gas and temperature retrievals difficult. Further development of the HIRDLS retrieval algorithms by H. Lee and Steven Massie has shown the potential for obtaining obtaining vertical structure of sub visual cirrus, Polar Mesospheric Clouds (PMC), Polar Stratospheric Clouds (PSC), and fire-induced smoke aerosols in addition to background and volcanic sulfate aerosols. An example of smoke from a Boreal fire is shown in HIRDLS Figure 4, with an example of a retrieval of this smoke that has reached the upper troposphere and above, where HIRDLS can observe it.
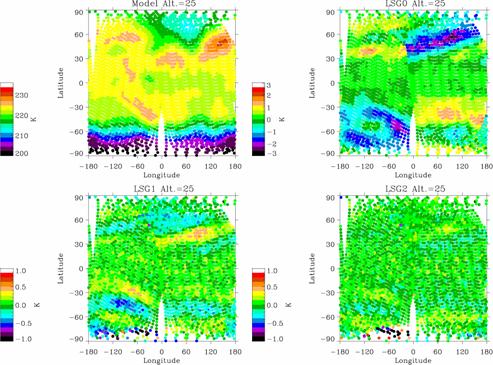 |
|||
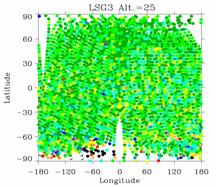 |
|||
HIRDLS Figure 3: Panel 1 (top left)-Original MOZART temperature plot in Southern Hemisphere (SH) spring on 25 km altitude surface. Note large gradients at edge of Antarctic vortex, and in NH high latitudes. Panel 2 (top right)-retrieval errors after retrieval, with no correction for line of sight (LOS) gradients. Panels 3-5 (bottom row, left to right; retrieval errors when LOS gradients from previous iteration are included in the retrieval. Note change in scale of the color bar for errors between Panels 2 and 3.
 |
|||
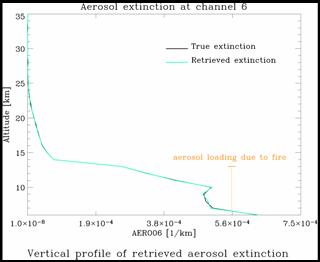 |
|||
HIRDLS Figure 4: Left- MODIS image of smoke from a Boreal fire. Right- simulation of retrieval of aerosol loading using HIRDLS Channel 6. Note sharp layer at 10 km, and rapid fall-off above.
In order for the retrieval to work, the code that calculates the radiance emerging from the atmosphere for a specific set of atmospheric conditions of temperature, composition, etc., must be accurate (to 0.5 or 1%) and fast. Significant progress has been made in the development of the HIRDLS fast forward model. Francis, Edwards, and Halvorson have used the Curtis-Godson (CGA) and Emissivity-Growth (EGA) physically-based fast forward techniques to provide the basis of the operational model. These approaches each give channel radiances accurate to a few percent (with respect to line-by-line calculations) and tend to have comparable errors of opposite sign. Radiance errors are reduced using a weighted sum of CGA and EGA. Remaining errors are dominated by spectral line overlap, and are treated using a statistical approach that further reduces the operational error to within design requirements.
Examples of the accuracies achieved for a large set of atmospheres are shown in HIRDLS Figure 5 for Channel 2 (temperature, with most opacity due to CO2), and Channel 11 (ozone, with major contribution for high altitudes). The blue lines indicate ± 0.5%, the requirement for the temperature channels. The three lines indicated the maximum, minimum and mean errors for the data set.
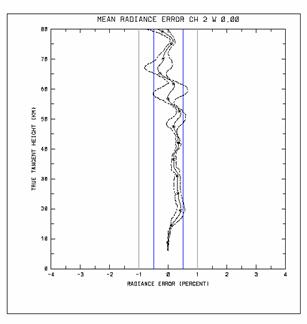 |
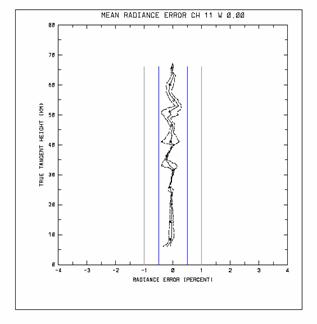 |
HIRDLS Figure 5: Forward model radiance errors for a large set of atmospheres for Channel 2(temperature retrieval, with most opacity due to CO2) and Channel 11 (ozone). The vertical blue and black lines indicate ± 0.5% and ±1%, respectively. Three lines plotted are maximum, minimum and mean errors for the data set.
The retrieval team develops their algorithms according to rigorous standards, in the same Fortran 90 environment as the operational processor. Stone and his team of software engineers, including Craig and Krinsky, McInerney, and Petersen works closely with the algorithm team to ensure that appropriate testing of prototype algorithms is completed prior to installation of new algorithms into an operational code build. This code also ingests, checks, inventories and conditions the data before they can be processed. In parallel, Cavanaugh has been developing code to test the L1 processor, (which converts raw HIRDLS data to calibrated, geolocated radiances), that Oxford is providing.
This code is then delivered to the Science Investigator-led
Processing System (SIPS) group. SIPS includes the computers, scripts,
and personnel
who will do the actual data processing. The SIPS will receive data from
the Goddard Data Analysis and Archiving Center (DAAC), process the data
in a mostly automated way, and return the processed data to the Goddard
DAAC for archival and distribution. Lauren, Young , and
Torpey have led the development of the
SIPS capabilities and testing them in Mission Operations Software Systems
tests,
while Dean has been responsible for testing the proper
running of the code in the SIPS.
Use of WACCM in Development of the HIRDLS Experiment
Douglas Kinnison has been extending the chemistry in the MOZART model to include reactions important in the stratosphere and mesosphere, as well as those needed in the troposphere. This version, MOZART 3, is a component of the Whole Atmosphere Community Climate Model (WACCM). WACCM and MOZART3 are supported in part by HIRDLS funding. As part of his HIRDLS activities, he has provided results of model runs simulating the evolution of the distributions of almost all relevant species that will be seen by HIRDLS and the other instruments on the Aura spacecraft. These have been used in the algorithm tests mentioned above, and also as pathfinders for problems to be attacked using HIRDLS data.
As an example, inferring ozone loss from satellite data requires that ozone variations due to dynamical perturbations be taken into account. Currently several techniques to accomplish this exist; however, many only consider vertical descent of ozone. In order to account for ozone variations due to both vertical descent and horizontal mixing, Kinnison worded with Cora Randall (CU) and Cynthia Shaw (graduate student at CU) to use a three-dimensional chemical transport model (CTM). Results from three CTMs, SLIMCAT, REPROBUS, and MOZART3, were used to infer chemical ozone loss from observations from the Polar Ozone and Aerosol Measurement (POAM) III instrument inside the vortex during the1999/2000 and 2002/2003 Arctic Winters. In order to deduce the dynamical change of ozone each CTM was run in a passive mode, in which ozone was treated as a dynamical tracer, from early December until the middle of March. They are estimating chemical ozone loss by subtracting the model passive ozone, evaluated at the time and location of the POAM observations, from the POAM measurements themselves. This technique relies on the accurate initialization of the CTM and a realistic description of vertical/horizontal transport. Therefore, it is important to understand the sensitivity of ozone loss inferences to model uncertainties, which vary depending on the meteorological conditions. This procedure will be continued after the Aura launch with the high resolution HIRDLS data.
In a related study, Kinnison and colleagues examined Antarctic ozone depletion in 2001 and 2002. The year 2002 had a unique sudden warming in late September. This warming was unprecedented in the historical record. To examine Antarctic ozone loss this winter and preceding winters, they obtained ECMWF analyzed fields of meteorological data to use in conjunction with the MOZART3 chemical transport model. Comparisons of local (POAMIII) and total column ozone (see HIRDLS Figure 6) were made. This work will be submitted for peer review next year. Continued evaluation of Antarctic ozone loss will be done with HIRDLS data after launch.
In another example, Kinnison and Laura Pan have evaluated mixing processes in the extra-tropical UTLS region, a region of high priority for HIRDLS. They have explored studies, using ER2 aircraft data, where they examined O3/CO and O3/H2O tracer/tracer correlation in this region. To get a global prospective on mixing processes and to evaluate how well a model represents mixing in this region, they used the same MOZART3/ECMWF simulation discussed above (HIRDLS Figure 7). In general the model represents the extra-tropical mixing reasonably well. However, the observational record is sparse – having, high resolution HIRDLS tracer data in this region will be of great value.
Another study examined the distribution of future HIRDLS constituents near the tropopause using HALOE data. Comparison to the MOZART3 model driven with WACCM1b meteorological fields was also preformed. This study was both a validation of the data and an evaluation of the model in this region of the atmosphere. Results have been submitted for publication. (Park, M., W.J. Randel, D.E. Kinnison, R.R Garcia, and W. Choi, Seasonal Variation of Methane, Water Vapor and Nitrogen Oxides near the Tropopause: Satellite Observations and Model Simulations, J. Geophys. Res., in review, 2003).
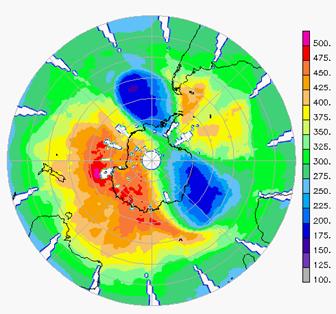 |
|||
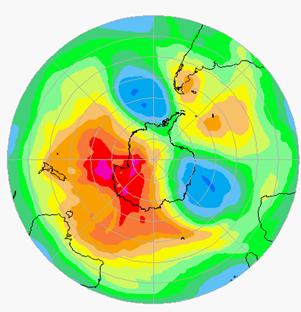 |
HIRDLS Figure 6: Total column ozone (Dobson Units) observed by the Total Ozone Monitoring System on the Earth Probe satellite, (EPTOMS), compared to model results from MOZART 3 driven by ECMWF winds.
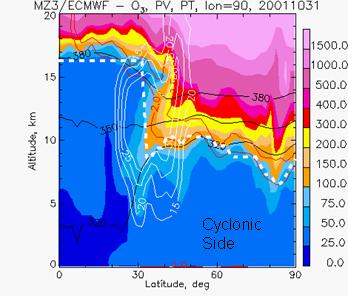
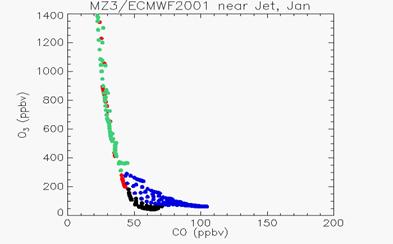
HIRDLS Figure 7: Left panel- NH cross section of ozone at 90° E from MOZART model driven by ECMWF winds. Black lines indicate potential temperature surfaces, while white lines are zonal winds,while the white dotted line is the thermal tropopause. Note the O3 intrusion below the tropopause. Right panel- tracer/tracer correlations between ozone (stratospheric source) and CO (tropospheric source). Blue dots are from the cyclonic side, indicating mixing is primarily occurring there. There is limited data to verify this at this time.
The Optical Techniques (OT) Group (Mike Coffey and James Hannigan) operates a Fourier transform infrared spectrometer at Thule, Greenland (76.53°N), as one of the Network for the Detection of Stratospheric Change (NDSC) primary stations. The NDSC is a network of high quality ground based observing stations for early measurement of changes in the composition and state of the stratosphere and determination of their causes. They obtained data automatically, with monitoring from Boulder, whenever the weather was suitable and the sun was above the horizon. Those data were analyzed for column amounts of gases, including both stratospheric gases important in ozone chemistry and tropospheric gases related to climate change.
In conjunction with other observations from the network, composed mostly of instruments from nations other than the US, the OT Thule measurements were used in the validation activities of recently launched satellite-borne instruments. Successful collaborations are underway with instruments aboard the European Environmental Satellite (Envisat) (EU) and Advanced Earth Observing Satelite (ADEOS)-II (Japan) platforms; plans and collaborations have been established for the Canadian Science Satellite, SCISAT-I (Canada, August 2003) and Earth Observing System (EOS)-Aura (United States, United Kingdom, Netherlands, Finland, March 2004) satellites.
The shape of spectral lines in the infrared contains information on the height distribution of the absorber up to altitudes, typically 30 km, at which Doppler effects overwhelm pressure broadening. The OT Thule spectrometer has sufficient resolving power, about a million, to allow inversion of the line shape to produce a low-resolution vertical profile. In collaboration with ACD Affiliate Scientist Aaron Goldman (University of Denver) and visitor Frank Hase (IFK, Karlsruhe), the OT group developed a method for the inversion, and a paper describing the technique was submitted for publication.
As co-investigators on the High Resolution Dynamics Limb Sounder (HIRDLS) instrument for EOS-Aura, to be launched in 2004, OT personnel prepared for data reduction and scientific analysis to be performed promptly after launch. This involved collaboration with other members of the HIRDLS science team, including James Holton and Conway Leovy of the University of Washington and Cora Randall, O. Brian Toon, and Linnea Avalone of the University of Colorado as well as members of the British science team, to define specific investigations, define requirements for operational modes and data analysis, and plans for scientific analysis. OT staff also assisted in instrument calibration and testing as HIRDLS, now integrated with the spacecraft, undergoes the final stages of preparation before launch.
Results from observations by the airborne Fourier transform spectrometer (0.06 cm-1 resolution), that span more than 20 years, were used to describe the long-term change and latitudinal distributions of four stable isotopes of water in the lower stratosphere and upper troposphere. Water transfer across the tropopause and redistribution in the lower stratosphere are important factors to the chemistry, radiation and dynamics of that important atmospheric transition region. Variations in the behavior of the water isotopes can provide insight into the sources and distribution of water. A presentation was made of the results at an international meeting and a manuscript has been produced and internally reviewed.
As platforms for the deployment of operator-assisted high-resolution spectrometers become more scarce and yet the need for airborne remote measurements is still acute, the OT group has developed a more compact (within the limits of long internal path length) high resolution (0.003 cm-1) Fourier transform spectrometer for use aboard the new NCAR research aircraft. That instrument, expected to be completed in 2004, may be capable of autonomous wing pod deployment aboard the High-performance Instrumented Airborne Platform for Environmental Research (HIAPER).
The Laboratory Kinetics (LK) Group (Geoffrey Tyndall and John Orlando) has continued its studies of tropospheric oxidation processes, maintaining an emphasis on the chemistry of volatile organic compounds.
Sodium azide (NaN3), the principal active ingredient in automobile air bag inflators, is readily hydrolyzed to hydrazoic acid (HN3), a volatile and toxic substance that partitions strongly to the gas phase. With increasing demand for sodium azide, which now exceeds 5 million kg/yr, there is a concomitant increase in the possibility of human exposure to hydrazoic acid and hence a need to understand the atmospheric fate of this compound. Scientists in ACD, in collaboration with Eric Betterton (University of Arizona) and Joe Lowry (U.S. EPA), have conducted laboratory experiments that show that HN3 is a fairly long lived species in the troposphere, with a lifetime of 1-2 days. Results show that solar photolysis and reaction with OH both contribute (about equally) to the atmospheric destruction of HN3.
LK Figure 1: The ultraviolet spectrum (solid line) and action spectrum (dashed line) for HN3, as measured by scientists in ACD. These data, coupled with measurements of its OH reaction rate coefficient, show that the tropospheric lifetime of HN3 is 1-2 days. Increasing demand for sodium azide for automobile air bag inflators makes human exposure to toxic HN3 an increasing possibility.
Scientists in ACD, in collaboration with Barbara Nozière (University of Miami), have developed a laminar flow reactor / proton-transfer mass spectrometer (PTr-MS) system for the study of organic peroxy radical (RO2) chemistry. Detection sensitivities for various RO2 radicals (R = cyclohexyl, cyclopentyl, ethyl, and methyl) were found to be high, consistent with a fast rate coefficient (~1x10⁻⁹ cm3 / molecule s) for proton transfer from water-proton clusters to the RO2 species. However, detection of the smaller radicals, methyl and ethyl peroxy, was significantly hindered by the presence of water vapor in the ion drift region. The cyclohexyl- and cyclopentyl-peroxyl radicals were reacted with NO and the products formed were probed via PTr-MS. Products identified include a wide array of mono-, di-, and tri-functional species containing peroxyl, alcohol, carbonyl, nitrate, and peroxynitrate functional groups. The identification of this wide array of products provides detailed and complete information regarding the mechanism of the atmospheric oxidation of cyclopentane and cyclohexane.
Despite many years of research, the oxidation of most alkanes has only been studied at room temperature. Over the last few years, ACD scientists have been systematically looking at the chemistry of a number of representative compounds over a range of atmospheric temperatures. The chemistry of the 1-butoxy radical has been studied as a function of temperature and oxygen partial pressure between 296 K and 251 K. Spectral features due to the 4-hydroxy butanal product formed from the isomerization of the radical were identified. By measuring the yields of butanal and 4-hydroxy butanal as a function of oxygen, the rate coefficient for isomerization could be measured relative to that for the O2 reaction. This was repeated at several temperatures and an estimate of the activation energy for isomerization was made. The activation energy appears to be in the range 7-9 kcal/mol, in good agreement with previous thermochemical estimates and recent quantum mechanical calculations. The measurements represent the first experimental study of this prototypical isomerization reaction as a function of temperature.
The reaction between HO2 and RO2 radicals represents an important chemical sink for HOx radicals under low NOx conditions. Based on a small number of product yield studies, these reactions are widely believed to form hydroperoxides almost exclusively (R1a), although several different reaction channels may be thermodynamically accessible
RO2 + HO2 → ROOH + O2 R1a
→ ROH + O3 R1b
→ RO + OH + O2 R1c
The mechanisms for the reactions of a number of peroxy radicals with HO2 have been studies using High Performance Liquid Chromatography (HPLC) and Fourier transformed infrared (FTIR). The HPLC measurements were made by Alam Hasson (Cal State Univ, Fresno), and were used to quantify hydroperoxides, while the FTIR could be used to monitor the starting materials and products such as carbonyls.
For the simple alkyl peroxy radicals CH3O2 and C2H5O2, the formation of peroxide (R1a) was confirmed to be the major, if not exclusive, channel. However, for acetyl peroxy and acetonyl peroxy radicals, reaction (R1c) was found to be the major channel. This is the first time that such non-terminating products have been identified in the reaction of an organic peroxy radical with HO2, and brings into question all previous measurements of both the reaction mechanism and the kinetics of these reactions. The findings will substantially reduce the formation of acetic and peracetic acids in the atmosphere, and may also impact the calculated levels of HO2 under low-NOx conditions.
The Heterogeneous Chemistry (HC) Group (David Hanson) studies the chemistry and physics of aerosol particles. This includes investigating their rates of formation (nucleation) and also, after they have grown to become long-lived particles, the uptake and reaction of gas-phase species on their surfaces. These processes can be key factors in the Earth's climate system and in atmospheric chemistry.
HC Highlight
The result (an uptake coefficient close to 1.0) is widely disparate with another group’s results. Attempts to explain this difference are controversial but would have a large effect on the understanding of how gases interact with liquid surfaces.
HC Accomplishments
The uptake of ammonia has been measured onto particles, and found to have an uptake coefficient close to 1.0. We are advancing the understanding of the differences between measurements of ammonia uptake by our laboratory and those of another laboratory. This controversy is not yet resolved but if the veracity of our measurements is to stand, there must be a detailed de-convolution of the data analysis procedure of the other measurement. A number of kinetic processes within the other group’s apparatus are known via only empirical investigations. We seek to understand them from first principles and to provide a physically based accounting of them. This might have far reaching implications in that many of the other chemical systems reported by this group might have to be re-investigated.
The laboratory techniques pioneered in ACD to explore particle nucleation at the molecular cluster level continue to be developed. A post-doctoral visitor, Karl Froyd, has been extensively modifying the apparatus and using new ionization schemes to better understand the formation of the molecular clusters formed in the H2SO4/H2O/NH3 system. In addition to corroborating previous results, the new measurements are filling in some of the significant gaps in knowledge of these clusters such as their dependence on ammonia concentration. Dr. Froyd is developing a cursory picture of the thermodynamics of these clusters from the measured distributions. This would be the first time the energetics of neutral clusters have been derived from their experimental observations.
This has been a collaborative study with the Laboratory Kinetics group. A summary is contained in their section. Along the same lines, a duplicate of the proton transfer mass spectrometer has been constructed in collaboration with Barbara Noziere of the University of Miami, Rosenstiel School of Marine Sciences. She plans to study the heterogeneous chemistry of peroxy radicals, and will maintain collaborations with HC in the future.
The Data Analysis and Assimilation Group
The Data Analysis and Assimilation (DAA) Group (William Randel, Andrew Gettelman, Boris Khattatov, Steven Massie, Laura Pan, and Fei Wu) focuses on studies of global scale chemical behavior using satellite data, meteorological data sets and model simulations. Recent work has focused on chemical and dynamical behavior of the tropopause region, both in the Tropics and extratropics, aiming to understand the processes which contribute to stratosphere-troposphere coupling.
Randel studied the interannual variability of stratospheric water vapor using Halogen Occultation Experiment (HALOE) satellite measurements during 1991-2003, to help quantify processes that control water vapor entry into the stratosphere. Interannual anomalies in water vapor with an approximate 2-year periodicity are evident near the tropical tropopause, and these propagate vertically and latitudinally with the mean stratospheric transport circulation (DAA Figure 1), in an analogous manner to the seasonal ‘tape recorder’. Unusually low water vapor anomalies are observed in the lower stratosphere for 2001-2002. Comparisons with balloon measurements of lower stratospheric water vapor at Boulder, Colorado (40°N) show partial agreement for seasonal and interannual changes during 1991-2003, but decadal increases observed in the balloon measurements for this period are not observed in HALOE data. Strong correlations are found between stratospheric water vapor and temperature anomalies near the tropical tropopause, providing a simple explanation for the global-scale water vapor changes.
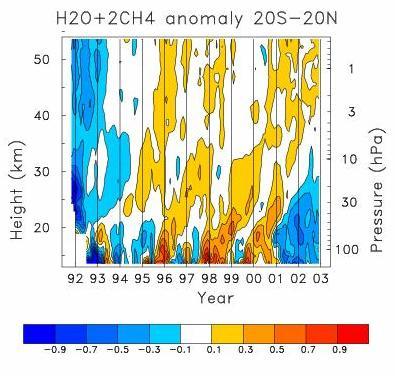
DAA Figure 1: Height-time section of deseasonalized anomalies in H2O + 2*CH4, derived from HALOE satellite measurements averaged over 20 N-S. Contours are +/- 0.1,0.3, ppmv. Interannual anomalies originate near the tropical tropopause and propagate upward with the mean stratospheric circulation.
Randel also collaborated with a graduate student from Seoul National University (Mijeong Park), along with Rolando Garcia and Doug Kinnison (ACD), to study the seasonal variation of methane, water vapor and nitrogen oxides near the global tropopause, based on HALOE satellite measurements and MOZART2 simulations. These species have strong gradients near the tropopause, so that their seasonality is indicative of stratosphere-troposphere exchange (STE) and circulation in the near tropopause region. Results show overall good agreement between observations and model results for methane and water vapor, whereas nitrogen oxides are much lower in the model than suggested by HALOE data (DAA Figure 2). The constituent seasonal variations highlight the importance of the Northern Hemisphere summer monsoons as regions for transport into the lowermost stratosphere. In Model for Ozone and Related Chemical Tracers (MOZART), there is clear evidence that air from the monsoon region is transported into the Tropics and entrained into the Brewer-Dobson circulation, bypassing the tropical tropopause.
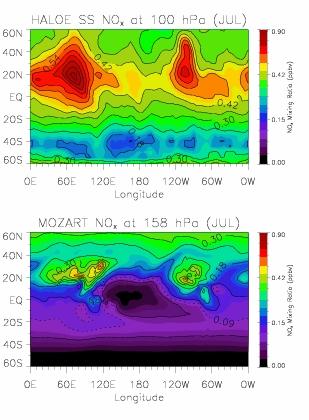
DAA Figure 2: Spatial structure of climatological NOx in July, derived from HALOE satellite measurements at 100 hPa (left), and from a MOZART3 simulation at 158 hPa (right). The HALOE data are a sum of the sunset measurements of NO and NO2, while the MOZART3 results show a full diurnal average. Note the relative maxima over the South Asian and North American summer monsoon regions, probably due to lightning generation of NOx.
Randel also organized a community assessment of climatological winds and temperatures in the middle atmosphere (over 10-80 km), based on detailed intercomparisons of contemporary and historic data sets. This activity was organized under the Stratospheric Processes and their Role in Climate (SPARC) program, and involved collaborations with 20 outside scientists. Data sets included global meteorological analyses and assimilations, climatologies derived from research satellite measurements, historic reference atmosphere circulation statistics, rocketsonde wind and temperature data, and lidar temperature measurements. The results provide an updated assessment of uncertainties in current middle atmosphere data sets, and helped isolate specific problems in several individual data sets. Results were published in an extensive SPARC Report.
Gettelman has coordinated an intercomparison of radiation codes in the tropical tropopause layer (TTL), in collaboration with researchers from the University of Reading (Piers Forster), University of Washington (Qiang Fu) and Hokkaido University (Masatomo Fujiwara). The objective of this work is to try to understand the thermal structure of the tropopause region and the location of the level of zero radiative heating, which is important for understanding how air and water vapor enter the stratosphere. DAA Figure 3 illustrates the longwave, shortwave and net radiative heating rates in the TTL derived from a radiative code used at NCAR (CCM3.6), with the contribution from various gases also indicated. By understanding the role of water vapor, ozone and carbon dioxide, we can also begin to approximate how the radiation balance might change in the future, given changes to these greenhouse gases.
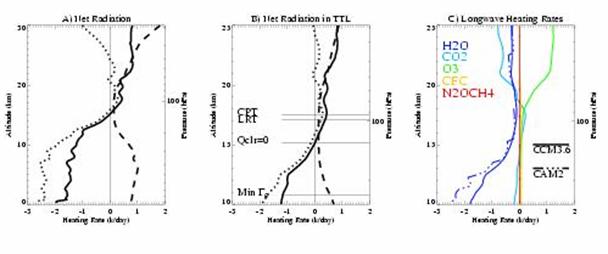
DAA Figure 3: Vertical profiles of diurnally averaged radiative heating rates (in K day-1) for tropical calculations in March. Results are derived from the NCAR CRM (CCM3.6). A) 0--30km and B) TTL (10--25km) Shortwave (SW) dashed, Longwave (LW) dotted and Net solid. C) Longwave (Infrared) heating rates broken down by gas for two versions of the NCAR-CRM
Gettelman is also involved with analyses of water vapor in the tropical tropopause layer, using satellite observations, idealized trajectory models, and the MOZART 3 model. The focus is to understand the processes which control variability of TTL water vapor, and accurately simulate these processes in various models. Work is continuing on both long term (20 year) runs, as well as detailed analyses of the summer of 2002, with comparisons to aircraft observations from Cirrus Regional Study of Tropical Anvils and Cirrus Layers - Florida Area Cirrus Experiment (CRYSTAL-FACE). Further studies involve developing models for understanding isotopes of water vapor, in conjunction with researchers from the University of Maryland (Andrew Dessler) and Caltech (David Noone). Modeling efforts include idealized models, as well as the development of isotopic code for NCAR's Community Atmosphere Model. This work is expected to result in community modules for simulating isotopes within CCSM during the next year.
Laura Pan has studied the chemical behavior in the vicinity of the extratropical tropopause using a combination of aircraft measurements and model simulations (Chemical-Langrangian Model of the Stratosphere [CLaMS] and MOZART3). In particular, the mixing of stratospheric and tropospheric air masses have been studied using interrelationships between the stratospheric tracer O3 and the tropospheric tracers CO and H2O. Data studies are done in collaboration with Bruce Gary and Michael J. Mahoney from JPL, Edward Browell from NASA/Langley, and Eric Hintsa from WHOI. The tracer relationships indicate that mixing of the stratospheric and tropospheric air masses occurs in the vicinity of the tropopause to form a transition layer between the stratosphere and the troposphere (DAA Figure 4). This transition layer is centered at the thermal tropopause. The transition layer is relatively sharp near 65°N (a region away from the jets), but spans larger altitude range near 40°N (in the vicinity of the subtropical jet), consistent with the enhanced stratosphere-troposphere exchange near the tropopause break. Model simulations of this type of processes are also being examined using the results of MOZART3, in collaboration with Douglas Kinnison of ACD and Jennifer Wei from the University of Illinois (now at UMBC).
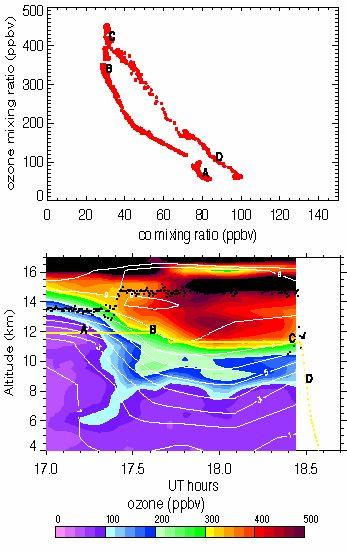
DAA Figure 4: Diagnosis of mixing between stratosphere and troposphere air during a cut-off low event from measurements onboard DC-8 during the SONEX mission. Upper panel shows the O3-CO relationship for the flight segment between 17 UTC and 18.7 UTC, with sloping lines indicating the mixing of stratospheric and tropospheric air. The lower panel shows LIDAR measured ozone mixing ratios (color image), ECMWF based PV contours (solid white), thermal tropopause derived from the MTP data (black dots), and the DC-8 flight altitude (yellow line). Letters A, B, C, and D marks the measurements at 17.2, 17.6,17.4, and 17.5 UTC respectively. Note that the mixing occurs over relatively limited spatial regions.
Steve Massie has focused on studies of cirrus clouds near the tropical tropopause, which are important for understanding stratospheric dehydration and the local radiative balance. Observations of tropopause cirrus, as measured by the Halogen Occultation Experiment (HALOE) and the Stratospheric Aerosol and Gas Experiment (SAGE II), were studied for years from 1984 through 1999, to quantify interannual variability. The area of cirrus clouds observed by both the HALOE and SAGE experiments in 1993 (following the volcanic eruption of Mt. Pinatubo) was substantially smaller than in previous or subsequent years, and this is similar to an observed decrease following the eruption of El Chichon in 1982. This decrease in tropopause cirrus following volcanic eruptions is not readily explained by cloud microphysics or temperature variations, and remains an outstanding question.
Identification of polar stratospheric cloud (PSC) composition by remote sensing instruments has proven to be an elusive goal of the remote sensing community. Massie collaborated with K. M. Lee of Korea to successfully identify polar stratospheric cloud (PSC) composition, based upon analysis of Improved Limb Atmospheric Spectrometer (ILAS) multiple-wavelength aerosol extinction measurements. Liquid nitric acid droplets and solid nitric acid trihydrate particles were identified in spectra measured in January and February of 1997.
Regional and Process Studies Group
The Regional and Process Studies (RPS) Group’s (Mary Barth, Rolando Garcia, Sasha Madronich, Xuexi Tie, Francis Vitt, Stacy Walters) research focuses on developing and refining models used for determining atmospheric processes
The Weather Research Forecast (WRF) model is the newest generation community mesoscale meteorological model developed by NCAR's MMM division. A version of WRF with on-line chemistry (WRF-Chem) is being developed by Georg Grell (NOAA/Forecast Systems Laboratory [FSL]). The WRF-Chem model is expected to become the leading regional scale chemistry-transport model and will replace the current generation of off-line air quality models, such as NCAR's Master Mechanism (MM)5/HANK (ACD’s regional-scale chemistry-transport model) or EPA's MM5/MODELS-3. At the present time, the WRF-Chem model is in its infancy and is not ready to be released to the community. Under FY'03 Opportunity Funding, Tie and Madronich have obtained a preliminary version of this model and are working with Grell to debug the code and perform comparisons with the HANK model. Graduate students Zhuming Ying (York University) and GuoHui Li (Texas A&M University) are assisting with the model improvements. We have successfully ported WRF-Chem over Mexico, added emissions data for Mexico City and the surrounding region, corrected some major coding problems, and performed initial 2-day simulations at 6 km resolution over Mexico. Preliminary results for carbon monoxide (CO) and ozone (O3) at the surface and at 1 km altitude are shown in RPS Figure 1. These results are very encouraging and clearly show the extent of the Mexico City plume over a ca. 300 km scale from the city to the Gulf coast. We find that CO is diluted in the plume while O3 continues to be produced far down-wind of the city, with values in the plume rivaling those at the surface in the city.
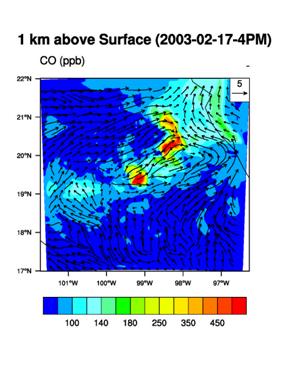
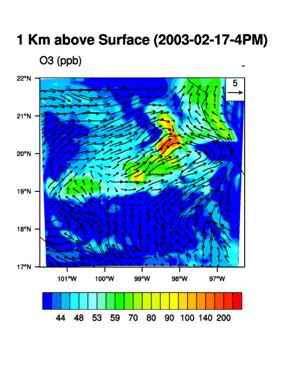
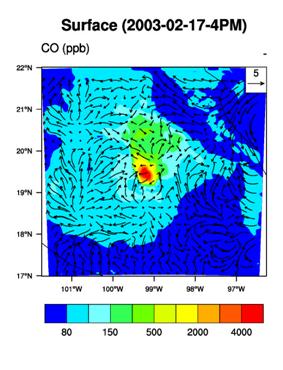
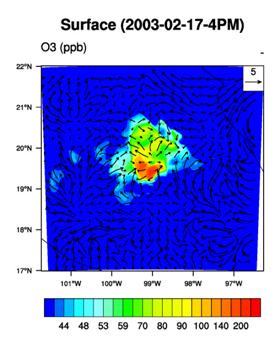
RPS Figure 1: WRF-Chem 2-day simulation of Mexico City outflow, at 6 km resolution (600x600 km domain). Mexico City is located in the center; the Gulf and Pacific coasts are visible in the upper right and lower left corners, respectively.
The Tropospheric Ultraviolet-Visible (TUV) model was updated with recently available spectroscopic data for the photo-dissociation of atmospherically important molecules and for atmospheric interest and for biological effects of UV radiation on plants. Evaluation of the model by comparison with direct measurements of spectral irradiances and actinic fluxes obtained at the International Photolysis Measurement and Modeling Intercomparison (IPMMI) was completed, and several papers have now appeared or are in press in J. Geophys. Res.
The TUV model was used by Julia Lee-Taylor and Madronich in a collaborative study with researchers from the Memorial Sloan Kettering Cancer Center (MSKCC) on the epidemiology of human melanoma skin cancer. The model was used to calculate the lifetime exposures to UV-B and UV-A radiation for ~3200 individuals who in interviews reported a history of various locations where they had lived. The effective UV-B and UV-A doses were computed for each reported location based on satellite-derived ozone and cloud cover, then integrated over the location-history of each individual. These cumulative exposures are now being used at MSKCC to examine the strength of correlation with melanoma incidence. While that aspect of the study is still under way, the results are expected to clarify the relationship between UV exposure and melanoma incidence (which to date remains controversial), and may have considerable impact on melanoma prevention and public education.
A theoretical study of the sensitivity of biologically-active radiation to stratospheric ozone changes was completed by Maria Isabel Micheletti (graduate student, University of Rosario, Argentina), Ruben Piacentini (University of Rosario, Argentina), and Madronich. A key aspect of this study was the assessment of the relative importance of the UV-B and UV-A wavelength ranges. Newly reported spectral sensitivity functions for damage to plants include substantial sensitivity to UV-A wavelengths. The theoretical analysis showed that because of this UV-A sensitivity, earlier studies have overestimated plant damage due to O3 depletion by as much as an order of magnitude. This study is the main topic of Micheletti’s Ph.D. thesis, and is described in a forthcoming issue of the Journal of the American Society for Photobiology (Photochem. Photobio., 2003, in press.)
Thomas Leapple (University Heidelberg), Jean-Francois Lamarque, and Madronich developed and tested a new method for deriving surface albedo at UV wavelengths, for use in global models such as MOZART. The method combines satellite-based climatologies of albedo for snow and non-snow covered areas with meteorological analyses of actual snowfall. The new albedo map was used with the TUV model to predict the ratio of up-welling to down-welling actinic fluxes measured from aircraft during the TOPSE field campaign, and showed consistently better agreement with the measurements than obtained with the albedo map currently used in the MOZART model. Use of the new albedo map should lead to better calculations of tropospheric photolysis rates and therefore more accurate predictions of global distributions of photochemical oxidants such as O3 and OH.
The complete atmospheric oxidation mechanisms for a series of hydrocarbons were developed by Bernard Aumont (University Paris) and Madronich, using a chemical “generator” code to predict reaction pathways and kinetics based on structure-activity relations. RPS Figure 2 shows the growth of chemical complexity as the size of the initial hydrocarbon increases. The generator code also allows for systematic simplification of the mechanisms at specified accuracy thresholds. The generation of simplified mechanism was the main Ph.D. thesis topic of Sophie Laval (University of Paris).
Madronich used the NCAR Master Mechanism to examine in detail the chemical composition of Mexico City outflow. The model was initialized with hydrocarbon and NOx measurements made in Mexico City. Air parcels exiting the city are found to contain large amounts of oxygenated organics, as well as nitric acid and hydrogen peroxide (up to 40 ppb). Remarkably, the reactivity of the air (quantified as the rate of production of peroxy radicals by OH reactions) remains high and relatively constant for at least 5 days following emissions (see RPS Figure 3). This model-predicted persistence of reactivity implies that urban pollution can have major effects on the regional and even global scale, and is one of the important hypotheses to be tested in the planned MIRAGE-Mex field campaign.
Significant Opportunities in Atmospheric Research and Science (SOARS) student, Nichole Spence, and Madronich analyzed the day-to-day variability of air pollution in Mexico City. Eleven years of hourly surface measurements of CO, O3, and NOx concentrations obtained at 32 locations within the city were examined, with the objective of determining whether there was significant accumulation of pollutants from one day to the next. Contiguous day pairs were examined to determine whether concentrations increased or decreased, and by how much. No statistically significant difference was found between the number of increases and decreases, nor between the average amounts of decrease or increase, suggesting that the pollution is ventilated out of the city every night. This result has potentially important implications for (i) air quality forecasting within Mexico City, by showing that multi-day simulations may not be necessary, and (ii) the MIRAGE-Mex field campaign, by showing that the initial state of regional-scale plumes can be associated with urban emissions from a single day, rather than from more complex multi-day urban mixtures.
 |
RPS Figure 2: Number of reactions and intermediate species required for explicit description of the atmospheric degradation of hydrocarbons. Note exponential growth of complexity for increasingly large initial hydrocarbons.
 |
RPS Figure 3: OH reactivity in Mexico City outflow, computed with the NCAR Master Mechanism. Note that the reactivity of all volatile organic compounds (VOC) persists almost unchanged for several days in the outflow.
The segregation of chemical species that is induced by turbulence is being examined with a large-eddy simulation (LES) coupled with gas-phase chemistry by Barth (joint appointment with MMM) and Edward Patton (Pennsylvania State University). The project focuses on the covariance of isoprene and hydroxyl radical, species whose reaction plays an important role in ozone production. The processes that produce and destroy the covariance of these two species are being analyzed to explain why the species are segregated under some chemical scenarios but not under other conditions. The results suggest that the covariance of isoprene and hydroxyl radical is tied to the covariance of isoprene and nitric oxide, since oxidation of nitric oxide maintains hydroxyl radical concentrations.
Barth, Si-Wan Kim, (MMM visitor), Patton, and Moeng have modified the LES coupled with chemistry to simulate cloud physics and aqueous chemistry. These modifications include improving the gas and aqueous-phase chemical reaction schemes to represent hydrocarbon chemistry more realistically. Studies of the chemical transport and transformation in the environment of continental fair-weather cumulus are being performed. Analysis of these results will indicate the importance of aqueous chemistry and cloud venting on the production of ozone. These detailed studies can then be used to guide the representation of the boundary layer and chemistry in large-scale chemistry models that must parameterize these processes. The coupled LES-chemistry code will continue to be developed to include a realistic dry deposition routine that has both micrometeorological and chemical characteristics.
To determine whether representing a cloud drop population with different sizes and pH values produces chemical constituent concentrations that are substantially different from numerical simulations which represent cloud drops with a single mean size and pH value, Barth and Roberto Cancel (SOARS student) have combined cloud parcel physics simulations with cloud chemistry simulations. The activation and growth of cloud drops are simulated by a cloud parcel model that represents a spectrum of cloud condensation nuclei. Its output, drop size and water content, is used in a gas-aqueous photochemistry model. The cloud chemistry is simulated as 1) a bulk water calculation with drop radius set to 10 mm, and 2) a population of drops with varying sizes. Preliminary results indicate that differences in several reactive soluble species (e.g., formaldehyde, formic acid) occur between the two microphysics parameterizations.
During FY03, the ACD Global Modeling (GM) Group (Louisa Emmons, Peter Hess, Jean-Francois Lamarque, Daniel Marsh, Anne Smith, Xuexi Tie, Stacy Walters) contributed to scientific advances in a broad area related to atmospheric chemistry and transport processes. The contributions described below are grouped into four categories: model development, science studies combining modeling and analysis of observations, theoretical and mechanistic modeling studies, and observational studies.
A gas-phase chemistry package suitable for tropospheric and stratospheric conditions has been implemented in the Whole Atmosphere Community Climate Model (WACCM) version of the Community Atmosphere Model (CAM)-2. Simulations were performed and analysis of the results is underway. The chemical scheme offers a complete description of hydrocarbon oxidation in the troposphere and of stratospheric ozone chemistry in the stratosphere. This package includes emissions, deposition (wet and dry), transport (large and subgrid-scale), and photochemical reactions for 106 species. Photolytic reaction rates are calculated using an approach similar to the Lawrence Livermore National Laboratory (LLNL) Look-Up-Table. Wet and dry deposition algorithms were taken from the Model for Ozone and Related Chemical Tracers (MOZART). All algorithms have been implemented into the WACCM version CAM2. In this version, we have reduced the model extent to approximately 85 km. This altitude provides a natural boundary across which limited chemical transport occurs. The chemically influenced fields (such as ozone, CFCs, etc.) are fed back to the climate model and used in the radiative calculations.
In the process of integrating interactive chemistry into the climate model, ACD’s Global Modelers have performed a set of simulations to evaluate against measurements the performance of the model with interactive chemistry. These simulations were performed at the resolution of 2ox2.5o with 52 levels and for approximately 15 years. No drift was found in the simulated ozone field, indicating the lack of misrepresented chemical mechanisms. The analysis of the simulated ozone field (GM Figure 1) for a variety of stations indicate that the model is performing very similarly to a tropospheric Chemical Transport Model (CTM) (MOZART-2) that has the same set of chemical species and reactions. The shortcomings of the simulations are therefore related to problems in emissions and/or chemistry, not in the coupling between the chemistry and the climate models.
Major model changes are also evaluated with numerous measurements, such as the “data composites” of aircraft observations, and ozonesondes. The results of the benchmarks are posted on an internal website for the development team. The continuing development of MOZART-2 is done in collaboration with Guy Brasseur and Martin Schultz, Max Planck Institute (MPI), Claire Granier, Centre National de la Recherche Scientifique (CNRS), and Lawrence Horowitz, Geophysical Fluid Dynamics Laboratory (GFDL).
In addition to ozone we have performed the comparison of the model results for other chemical species against surface CO from NOAA’s Climate Monitoring and Diagnostics Laboratory (CMDL) and aircraft measurements during specific campaigns. These results (GM Figures 2, 3, and 4) indicate that the model performs reasonably well in the simulation of more reactive species such as NOx. The evaluation of the stratospheric portion of the model is underway.
The group is now in the process of having interactive emissions of biogenic volatile organic compounds (VOCs) from the Common Land Model (CLM) used as boundary conditions for this model.
Phil Rasch (NCAR/CGD), Walters, Hess, and Vitt are developing an off-line version of the on-line chemistry model (CAM) embedded within the CCSM framework. This model will import meteorological fields from other sources (e.g., National Centers for Environmental Prediction [NCEP], European Centre for Medium-range Weather Forecasting [ECMWF]) into the CAM model instead of using internally generated fields. This provides the opportunity to simulate the transport and chemistry of trace constituents (reactive and passive species and aerosols) using meteorological analysis. These distributions can then be compared with measurements on an episodic basis and used in process studies. This model introduces a new capability into the CCSM framework and reduces the software engineering effort required for maintaining multiple chemical transport models within the same institution. It also allows improvements to the consistency of representations of physical processes within the model and allows all components of the climate system to influence the chemical simulations. The group anticipates that this model will replace the MATCH and MOZART CTMs.
In FY03, the group successfully simulated simple trace constituents within the CCSM framework using imported meteorological fields. These tracers include radon, SF6, an ozone-like tracer, and other diagnostic species. An example can be seen in GM Figure 5, which compares simulations of radon near 200 mb using the original version of CAM and a version of CAM run as an offline model.
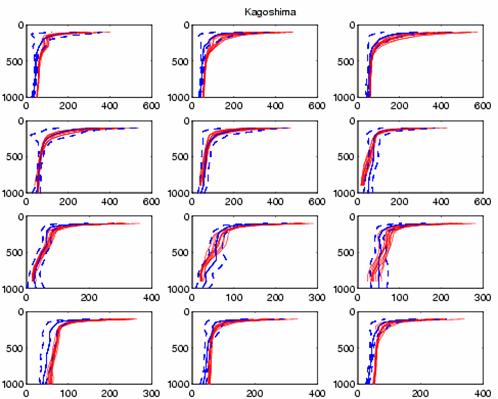
|
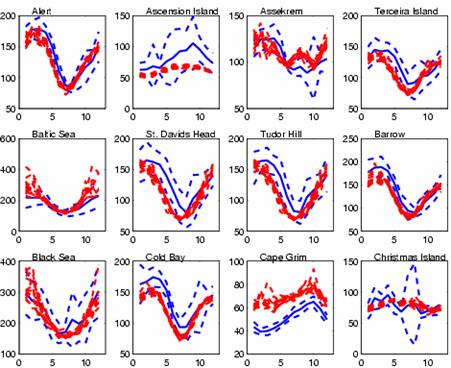
|
|
|
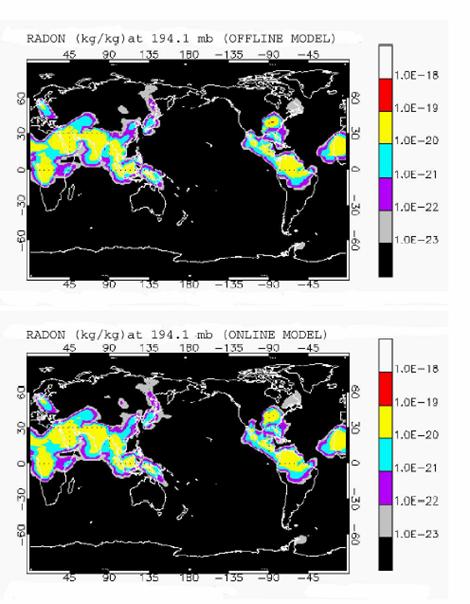
GM Figure 5: Simulations of radon near 200 mb using the original version of CAM and a version of CAM run as an offline model
The development of simulations of 13CO and C18O in MOZART-2 has been started in collaboration with John Mak, State University of New York (SUNY) Stony Brook. Since measurements of the isotopes provide an additional constraint on the source contributions to the distribution of CO, they can be used to improve emission inventories. The time period of 1997-2001 will be simulated using analyzed meteorology and annually varying emission inventories so comparison can be made to measurements at several sites, including Barbados, Mauna Loa, Canary Islands and Spitsbergen. Significant interannual variation is seen at these sites in both CO mixing ratios and in the isotope ratios, and we hope to explain these changes with the model simulations.
Cloud layers in the troposphere influence photolysis frequencies (J values) and hence the concentrations of chemical species. In order to study the impacts of clouds on photolysis frequencies and oxidants, we have developed a simplified version of the NCAR Tropospheric Ultraviolet-Visible Model (TUV), and have coupled the simplified TUV (FTUV – Fast TUV) into the MOZART model. The FTUV model has the same physical processes as the TUV model, except that the wavelength bins between 121-750 nm are reduced from 140 to 17. As a result, FTUV is about 8 times faster than the original TUV. The differences in the calculated photolysis frequencies between TUV and FTUV are generally less than 5% in the troposphere. The sub-grid vertical distributions of clouds are considered in the calculation of photolysis frequencies in MOZART. The method used in this study is a mixed maximum and random overlap scheme. The sub-grid method increases the computation time for photolysis frequencies by a factor of 3 compared to a simple method in which cloud is uniformly distributed over the MOZART grids. Our calculation shows that the uniform cloud distribution method tends to significantly overestimate backscattering on the top of clouds and the impact on photochemistry in the troposphere. The results suggest that clouds have important impacts on tropospheric chemistry. First, global mean OH concentration increases by about 20% due to the impact of clouds. As a result, the calculated CH4 lifetime is 11 years for clear sky and 9 years for cloudy sky. The latter value is closer to the methane lifetime estimated from previous studies. The calculated CO surface concentrations are compared with observed values, showing an improvement when the impact of clouds on the photolysis frequencies is taken into account. Second, clouds have important impacts on tropospheric ozone budget. The calculation reveals that because of clouds, the globally averaged photolysis frequencies of J[O3], J[CH2O], and J[NO2] are enhanced in the troposphere by about 12, 13, and 13%, respectively, leading to an 8% increase in the tropospheric O3 concentrations. Our study reveals that clouds strongly influence photolysis frequencies and hence play an important role in controlling the concentrations of the tropospheric oxidants. Such effects should be carefully considered.
An aerosol model for MOZART-2 is developed and used to evaluate the interactions between aerosol and chemical oxidants in the troposphere, including (1) the conversion from gas-phase oxidants into particle phase during the formation of aerosols, (2) the heterogeneous reactions occurring on the surface of aerosols, and (3) the effect of aerosols on ultraviolet radiation and photolysis rates. For this study, we have upgraded the “standard” MOZART-2 model. These upgrades include: (1) replacement of a “look-up” photolysis table by an on-line radiative transfer model (a modified version of NCAR’s Tropospheric Ultraviolet Visible [TUV] model), (2) on-line calculation of global aerosol distributions, and (3) inclusion of interaction between aerosols and tropospheric oxidants. The aerosols included in the model are sulfate, soot, primary organic carbon, ammonium nitrate, secondary organic carbon, sea-salt, and mineral dust particles. The simulated global distribution of the aerosols is analyzed and evaluated with satellite measurement data from Moderate Resolution Imaging Spectroradiometer (MODIS). The results suggest that in northern continental regions, the tropospheric aerosol loading is high in Europe, North America, and East Asia. Sulfate, organic carbon, black carbon, and ammonium nitrate aerosols are major contributions for the high aerosol loading in these regions. High aerosol loading is also shown in the Amazon and south and central Africa, and this high aerosol loading is mainly consistent of organic carbon and black carbon. Over southern high latitude ocean (around 60oS), there is high sea-salt aerosol. The mineral dust has highest concentrations in the Sahara, and spread out in adjacent regions by transport. The model and MODIS both show the above aerosol geographical distributions. However, the model results likely overestimate the sulfate and organic carbon aerosol in Europe and East Asia. In the high aerosol loading regions, aerosols have important impacts on tropospheric ozone and other oxidants. The model calculation suggests that heterogeneous reactions of HO2, CH2O on sulfate have an important impact on HOx concentrations, and heterogeneous reaction of O3 on soot has a minor effect on O3 concentrations in the lower troposphere. Heterogeneous reactions on dust have very important impacts on HOx and O3 in the dust source region, leading to a maximum of 40% reduction in HOx, and 20% reduction in O3 over the Sahara Desert. The dust, organic carbon, black carbon, and sulfate aerosols have important impacts on photolysis rates. For example, J[O3] and J[NO2] is reduced by 20% at the surface in the Sahara, the Amazon, and Eastern Asia, leading to 5 to 20% reduction in HOx, and a few percent changes in O3 in these regions.
The following additional components have been implemented and tested in MOZART-2: A new chemistry mechanism with speciated emissions, online dry and wet deposition, and an internally calculated water vapor distribution. Hess, David Baker (CGD), Gabrielle Petron (ASP), and Tomislava Vukicevic (Colorado State University [CSU] / Cooperative Institute for Research in the Atmosphere [CIRA]) have also begun development of an adjoint to the MOZART-2 model as part of an ITR grant. An initial adjoint to the advection algorithm has been developed and is being tested and refined.
Global Modeling Science Studies Combining Modeling and Analysis of Observations
The analysis of the ozone budget for TOPSE using MOZART-2 and HANK was published (Emmons et al., JGR, 2003). Following careful evaluation of the two models using the aircraft and ozonesondes measurements made during the TOPSE campaign, (see GM Figure 6) the relative contributions of chemistry and transport to the ozone budget in the northern middle and high latitudes during winter and spring were determined. It was found that chemical production and destruction were the dominant drivers of the observed spring ozone maximum. The contribution of stratosphere-troposphere exchange was also investigated using different estimates.
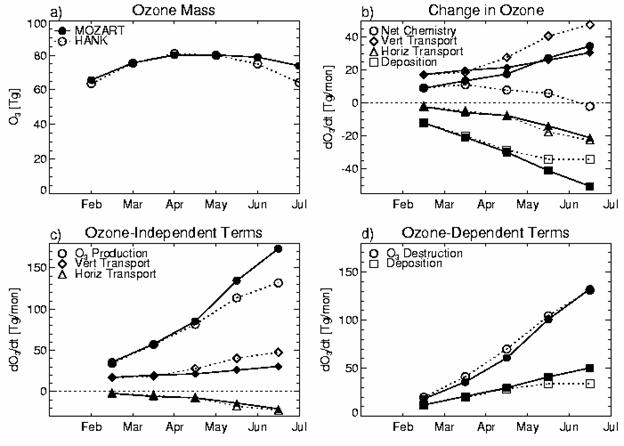
GM Figure 6: This figure shows the ozone budget of MOZART and HANK for the northern middle and high latitudes (30°-90°N, surface to 350 hPa). (a) total O3 mass for first day of each month; (b) monthly rates of change in ozone mass, due to chemistry, horizontal (northward) and vertical (downward) transport and deposition; (c) contributions to ozone sources: chemical production and net transport; and (d) contributions to ozone sinks: chemical destruction and deposition.
Kazuyo Murazaki-Adachi and Hess ran the MOZART-2 model for the period between 1990-2000 and 2090-2100 to examine impact of climate on U.S. air quality. The emissions during these periods are assumed to be the same. Statistically significant changes in the transport and chemistry of ozone are found. In particular, the lifetime of ozone decreases in the 21st century, suggesting that Asian emissions will have less affect on U.S. air quality in the future. Results for the period 1990-2000 were successfully compared with the EPA’s Atmospheric Infrared Sounder (AIRS) ozone network data.
In this study, the Global Modeling Group has performed the comparison between observed and modeled dry deposition of ozone over the Harvard Forest site. The comparison is done over a period of 4 years and with a variety of analysis tools, namely Fourier and wavelet analysis. It was shown that the model tends to reproduce most of the observed signal, especially if it is forced using the meteorological fields from the observation site instead of National Centers for Environmental Prediction (NCEP) analysis. Precipitation was shown to be the one meteorological variable whose impact on dry deposition velocity is not accurately reproduced. This work was done with Edouard Davin, who visited NCAR from March through August. There is a paper in preparation which the group intends to submit by the end of the year.
Observations of the 6-hour tide are compared with simulations from the Rural Oxidants in the Southern Environment (ROSE) model. Radar observations of horizontal winds at Esrange (68oN, 21oE) indicate that this tidal periodicity is a consistent part of the diurnal variation and is largest during midwinter. Vertical structure and phase coherence provide strong support that the observed oscillations are tidal. Model simulations generate a tide that has many similarities to the observed tide at Esrange. Diagnostic model tests indicate that the tide is forced primarily by the 6-hour component of solar heating. Globally, the monthly mean simulated tide is dominated by the migrating component except near the poles, although the contribution from nonmigrating mode is not negligible. According to the model, both migrating and nonmigrating 6-hour tides have small amplitude in low latitudes. This work was done in collaboration with Dora Pancheva and Nicholas Mitchell, University of Bath, United Kingdom.
Theoretical and Mechanistic Global Modeling Studies
ACD’s Global Modeling Group uses a global chemical transport model (MOZART-2) to estimate the effects of surface emissions of methanol on tropospheric oxidants. The importance of methanol in tropospheric chemistry is two-fold. First, methanol has a relatively large surface emission with an estimated global emission of 70 to 350 Tg methanol/year. The estimated methanol flux is comparable to other major hydrocarbon surface emissions such as isoprene and total monoterpenes, but the chemical lifetime of methanol is several days (in the boundary layer) to a few weeks (in the upper troposphere), which is much longer than the chemical lifetime of isoprene or monoterpenes (For example, the chemical lifetime of isoprene is about 2 hours). With a surface emission of 104 to 312 Tg methanol/year (encompasses estimated uncertainty in methanol emissions), the calculation shows that on average, the inclusion of methanol emission produces approximately 1-2% increase in O3, 1-3% decrease in OH, 3-5% increase in HO2, and 3-9% increase in CH2O globally. The maximum perturbation to the oxidants occurs in the tropical upper troposphere. However, the uncertainty associated with current methanol emission estimates produces significantly different model predictions of tropospheric oxidant distributions.
Hess used the MOZART-2 model to examine convective versus synoptic transport of tropospheric trace species. The results show the seasonal and geographic influence of convection on the transport of tropospheric trace species. It is found that the lower midlatitude troposphere is dominated by the transport by synoptic systems, while the equatorial regions and upper mid-latitude troposphere is dominated by tracers which have passed through a convective cloud. The convective influence in the mid-latitude upper troposphere of the N.H. has a large annual cycle, with the influence of the monsoon circulations extending down to 600 mb during the summer months. The microphysical processes in convective versus synoptic scale motions, and their different influence on the chemistry and chemical transport is likely to be important and needs to be considered in measurements of the UTLS region.
A sodium layer exists in the upper mesosphere that is fed by meteoritic input and is highly variable due to dynamical, chemical and ion processes. The chemical lifetime of the mesospheric sodium layer is calculated from the eigenvalues and eigenvectors of the Na chemical system. This method determines a lifetime that is an excellent estimate of the relaxation time of the sodium chemical system. The lifetime is more than a day in the vicinity of the mesospheric sodium layer and is much longer than the traditionally-defined chemical lifetime for atomic sodium of a few minutes.
In a related study, we develop two models of the response of the sodium layer to gravity waves. The dynamical and photochemical effects are coupled and ion reactions are included. One is a linear model, and the other is a coupled nonlinear model. The main differences between the simulations by the two models occur for sodium evolution near the peak and the bottomside of the sodium layer. Simulations indicate that a stable gravity wave induces large perturbations to the atomic sodium distribution at the bottomside of sodium layer and that the perturbations are in phase with those of temperature. At the topside of the layer, sodium and temperature perturbations are out of phase. The response of the sodium layer to gravity waves is largest around 86 km, in the bottomside of the sodium layer where the vertical gradients of sodium are larger. The sodium studies were done in collaboration with Jiyao Xu, Chinese Academy of Science.
The ROSE model was used to investigate the sources of quasi-stationary planetary waves often observed in the upper mesosphere. In particular, there are two mechanisms believed to be important. First, under certain conditions determined by the background zonal wind direction, wave propagation from the stratosphere to quite high altitudes (100 km) might occur. The other mechanism involves longitudinal variations in the filtering of upward propagating gravity waves by planetary scale wind variations in the stratosphere. Various tests with the model were used to distinguish the two processes. The results show that both processes make a contribution. The upward propagation of Rossby waves is dominant below 80 km and the in situ generation of planetary scale variations by gravity wave dissipation is dominant above 80 km.
This study shows the first identification of the Arctic Oscillation (AO) signature in the interannual variability of tropospheric ozone. For that purpose, we have analyzed the ozonesondes data for spring in the northern latitudes of the American and European continents from 1980 to 2001. It is shown that the variability in AO explains up to 50% of the tropospheric ozone variability in the lower troposphere over North America (GM Figure 7). In addition, using MOZART simulations for the same period, we have shown that the variability in the ozone distribution is a combination of reduced stratosphere-troposphere exchange during the positive phase of the AO and a redistribution of the ozone precursors. In particular, the stronger vortex during the positive phase of the AO reduces the transport of European emissions over the Polar Regions (as in TOPSE). This work was done in collaboration with Peter Hess and will be submitted in the next few weeks.
|
Empirical orthogonal function (EOF) analysis was used to study nitric oxide in the lower thermosphere using observations made by the Student Nitric Oxide Explorer. The dominant mode of variability is associated with auroral activity, followed by a seasonal effect, and then a response to varying solar extreme ultraviolet (EUV) flux. With the EOFs, we constructed a compact, three-dimensional empirical model of nitric oxide in the lower thermosphere that takes as input a planetary magnetic index, day of year, and 10.7 cm solar radio flux. Since it is possible that changes in lower thermospheric nitric oxide could lead to changes in stratospheric ozone, the model presented here can be utilized in climate simulations (using, for example, WACCM) without the need to incorporate many thermospheric processes.
Biological processes play key roles in the dynamics of the Earth system, modulating global and local carbon, nitrogen, trace-gas, water, and energy cycles. In turn, ecosystems and biogeochemical cycles are sensitive to physical and chemical forcing and the growing influence of human activities. The interactions of humans, natural and managed ecosystems, and the chemical and physical environment are complex, multidirectional, and nonlinear, and their study increasingly requires an integrated multidisciplinary approach. NCAR’s Biogeosciences (BGS) Initiative is a multidisciplinary collaboration that includes participants from ACD, ASP, ATD, CGD, ESIG, GSP, MMM, and SCD in an effort that combines intellectual challenge with great practical significance in the areas of climate, air quality, ecosystem health, and water resources. The initiative directly addresses the carbon cycle, a research priority in the administration’s Climate Change Research Program as well as interactions among the carbon, nitrogen, water and aerosol cycles called for in the NSF Geosciences Beyond 2000, and the International Geosphere-Biosphere Program.
The overall goal of the Biogeosciences Initiative is to incorporate the relevant aspects of the biological sciences into geophysics and atmospheric research. Key research areas include the carbon, nitrogen, and aerosol cycles which address three broad questions:
• How does biogeochemical coupling of carbon, nitrogen, iron and sulfur cycles affect climate, air quality, radiative forcing and ecosystem function on regional to global scales?
• How does heterogeneity in terrestrial landscapes interact with physical processes in the atmosphere to influence ecosystem processes, land-atmosphere exchange and local climate?
• How will human impacts and biogeochemical cycles evolve under a future climate, and what are the feedbacks and interactions among global and climate change, land management, urbanization, technological development, economics, and decision-making?
Addressing these questions requires the development of novel approaches to multidisciplinary research as well as a new set of tools, including sensors, platforms, data analysis techniques, and models. The BGS Initiative takes advantage of the breadth of science undertaken at NCAR to build an integrated science program that crosses spatial scales from process to global studies incorporating both models and measurements to address the interactions among biogeochemical cycles. Accomplishments during FY 2003 are presented below.
The documented acceleration of NH3 and NOx (NO + NO2) emissions over the last 150 years has accelerated N deposition, compromising air and water quality and altering the functioning of terrestrial and aquatic ecosystems worldwide. To construct continental scale N budgets, Elisabeth Holland (ACD), Bobby Braswell (Univ. of New Hampshire), James Sulzman (Oregon State Univ.), and Jean-Francois Lamarque (ACD) produced maps of N deposition fluxes from site-network observations for the US and Western Europe. Increases in the rates of N cycling for these two regions of the world are large and they have undergone profound modification of bio-atmospheric N exchanges, and ecosystem function. The maps are necessarily restricted to the network measured quantities and consist of statistically interpolated fields of aqueous NO3- and NH4+, gaseous HNO3 and NO2 (in Europe), and particulate NO3- and NH4+. There remain a number of gaps in the budgets including organic N and NH3 deposition. The interpolated spatially continuous fields allow estimation of regionally integrated budget terms. Dry deposition fluxes were the most problematic because of low station density and uncertainties associated with exchange mechanisms at the land surface. We estimated dry N deposition fluxes by multiplying interpolated surface air concentrations for each chemical species by model-calculated, spatially explicit deposition velocities. Deposition of the oxidized N species, by-products of fossil fuel combustion, dominate the US N deposition budget with 2.5 Tg of NOy-N out of a total of 3.7-4.5 Tg of N deposited annually onto the conterminous US. Deposition of the reduced species, which are by-products of farming and animal husbandry, dominate the Western European N deposition budget with a total of 4.3-6.3 Tg N deposited each year out of a total of 8.4-10.8 Tg N. Western Europe receives five times more N in precipitation than the conterminous US. Estimated N emissions exceed measured deposition in the US by 5.3-7.81 Tg N, suggesting significant N export. In Europe, estimated emissions better balance measured deposition, with an imbalance of between –0.63 to 2.88 Tg N suggesting that much of the N emitted in Europe is deposited there with possible N import from the US. Our analysis of N deposition for these regions was limited by sampling density. The framework we present for quantification of patterns of N deposition provides a constraint on our understanding of continental bio-atmospheric N cycles. These spatially explicit wet and dry N fluxes also provide a tool for verifying regional and global models of atmospheric chemistry and transport, and represent critical inputs into terrestrial models of biogeochemistry.
The direct effects of atmospheric nitrogen deposition on nutrient availability, plant productivity, and biogeochemical cycling in ecosystems have garnered considerable research interest. In addition to these direct effects, nitrogen deposition may indirectly affect ecosystems through deposition-induced changes in the rates of insect herbivory. The extent to which these impacts on individual insects and insect populations might affect ecosystem-level carbon and nitrogen dynamics is unknown. CENTURY, a well-validated ecosystem model, was used by Heather L. Throop (University of New York, Stony Brook), E.lisabeth Holland (ACD), William J. Parton and Dennis S. Ojima (Colorado State Univ.) to explore the hypotheses that both nitrogen deposition and herbivory affect carbon and nitrogen storage patterns and flux rates, but that the effects of herbivory vary based on the deposition rate and herbivore response to plant C:N. In particular, if herbivore consumption rates and population dynamics are positively correlated with the rate of nitrogen deposition, then herbivory will counteract the strong positive impacts of nitrogen deposition on carbon and nitrogen dynamics. The preexisting CENTURY mammalian grazing functions were modified to reflect possible patterns of insect herbivory under conditions of elevated nitrogen deposition. Vegetative tissue loss to herbivores was modeled as a dynamic function based on the carbon to nitrogen ratio of aboveground vegetation. Three different herbivory response functions were created which represent a range of physiological and population responses to altered host plant C:N. Simulation results showed a strong increase in plant production, decreased plant C:N ratios, and increased soil organic carbon pools in response to increasing nitrogen deposition. Insect herbivory alone generally caused depressed above ground production, decreased soil organic carbon pools, and decreased nitrogen mineralization rates. At moderate deposition loads (over 3 g N m-2 yr-1) in cases where deposition rate and herbivory were positively correlated, herbivory acted to depress the positive influence of nitrogen deposition on carbon storage in soil and vegetative pools and caused strong increases in nitrogen mineralization rates. The results of these simulations suggest that herbivory may play an increasingly important role in affecting ecosystem processes under conditions of high nitrogen deposition. Including effects of herbivory in ecosystem analyses, particularly in systems where rates of herbivory are high and linked to plant C:N, may be important in generating accurate predictions of the effects of atmospheric nitrogen deposition on ecosystem carbon storage. Large differences in the results among the different modeled insect herbivory functions, however, demonstrate that differences in the physiological and population response of insect herbivores could affect ecosystem processes.
1. Christine Wiedinmyer (ACD), with Sam Levis (CGD), coupled the algorithms from Guenther et al. (1995) in the CLM. The model was run offline for evaluation purposes. The model was also run online with the Dynamic Global Vegetation Model and the CCSM for a period of 10 years to evaluate the interannual variability in the predicted biogenic emissions. This paper (Levis, S., C. Wiedinmyer, Bonan, G., Guenther, A., Simulating biogenic volatile organic compound emissions in the Community Climate System Model) has been submitted to Journal of Geophysical Research and reviewed. The revised paper was accepted for publication on June 9, 2003.
2. Future global vegetation maps have been created by Ron Nielson et al. (USFS and Oregon State University) using the MAPPS dynamic vegetation model driven by climate model output for future years (~ 2100). With these new land cover maps and climate drivers, biogenic emissions were estimated. These new emission scenarios (based on current and future land cover and temperatures) were input to the MOZART model. The magnitude of the change in emissions and global chemical budget are being evaluated.
A paper is being written to address the importance of land cover change on biogenic emissions, and, further, on global chemistry. This paper will include the sensitivity runs that were done to investigate the emissions and chemistry changes due to large-scale anthropogenic land cover changes in U.S. and Brazil. It will also include the work done with the MAPPS emissions and MOZART. All modeling is completed, but the analysis is still ongoing. This paper is in its preliminary stages. (Wiedinmyer, C., X. Tie, A. Guenther, R. Nielson, C. Granier)
3. Jean-Francois Lamarque has been incorporating biogenic emissions into the MOZART model, so that these will be calculated at every time step (instead of the model being fed monthly-averaged values). The CLM pft and monthly LAI maps (from Sam Levis) are used as inputs to the biogenic emissions module. The use of these maps is consistent with the inputs needed to calculate dry deposition within the model.
Based on recommendations and modeling procedures developed by Alex Guenther, biogenic emissions (isoprene, monoterpenes, methanol, and acetone) are calculated on an hourly time step. The way in which the emissions are calculated in this module differ somewhat from the way in which these emissions are calculated within the CLM, since the emissions here are scaled to PFT-based above-canopy emission rates, not PFT-based emission factors based on leaf mass as they are in the CLM. This has led to some questionable results that have yet to be worked out and are currently being looked at.
4. Future work with the Jean-Francois Lamarque, Alex Guenther, and Christine Wiedinmyer include:
i) Inclusion of more chemical species to the module to evaluate the importance of these emissions on the simulated global chemistry. The species to be added are: ethanol, acetaldehyde, ethane and propene. The impact of the inclusion of these specific biogenic emissions on regional and global chemistry can be then evaluated when the emissions are included.
ii) Incorporation of better land cover and emission rate maps that better identify the spatial distribution of biogenic emissions across the globe. Using these better maps, we can identify regional differences in chemistry that result from the redistribution of the emissions. Dry deposition parameterization can be assigned to the new mapping as well, to keep the framework consistent (Discuss possibility with Beth).
iii) Evaluation of future trends in biogenic emissions. As part of an EPA STAR grant, the MOZART model will be run for future years. The model will be driven by PCM outputs and include a period around 2050, and another, petentially at 2100. As part of the EPA project, we will be looking at future simulations of biogenic emissions and the effects on regional air chemistry. We can apply our emission scenarios on a global scale and run them with the MOZART-2 model. With these model simulations, we can better evaluate the relative magnitude of the effects of climate drivers and human perturbations on global chemistry.
(http://www.mmm.ucar.edu/science/abl/forest/)
Jielun Sun (MMM), in collaboration with Steve Oncley, Tony Delany, Britt Stephens and Teresa Campos at ATD, and Alex Guenther and Andrew Turnipseed at ACD, Russ Monson at CU, and Dean Anderson at USGS, led an investigation of CO2 transport over complex terrain at Niwot Ridge, CO, in September, 2002. The field campaign was sponsored by the NCAR Director’s Opportunity. Using the fund provided by MMM and Biogeoscience Initiative, she analyzed the data collected during the 2002 field campaign. She found that the spatial distribution of CO2 is not only sensitive to major steep slopes, but also small gullies associated with the small creek embedded in the steep terrain (BGS Figure 1). Although the drainage flow associated with the small gullies was shallow, but the CO2 concentration there was much higher than those over the steep terrain. Neglecting the CO2 transport along the small gullies would lead to significant underestimation of CO2 transport. The relationship between the spatial distribution of CO2 depends on radiative energy transfer and atmospheric wind gusts. Moderate wind gusts could wipe out the drainage flow in the small gullies, while the drainage flow over the steep terrain could survive. The results provide critical information on many on-going long term observational programs over the world, which currently ignore horizontal transport of CO2 in their effort to monitor the global CO2 budget. She will continue to work closely with colleagues at NCAR, CU, USGS, and University of Montana and carry the research by participating in the upcoming large-scale and multi-year field campaign at Niwot Ridge.
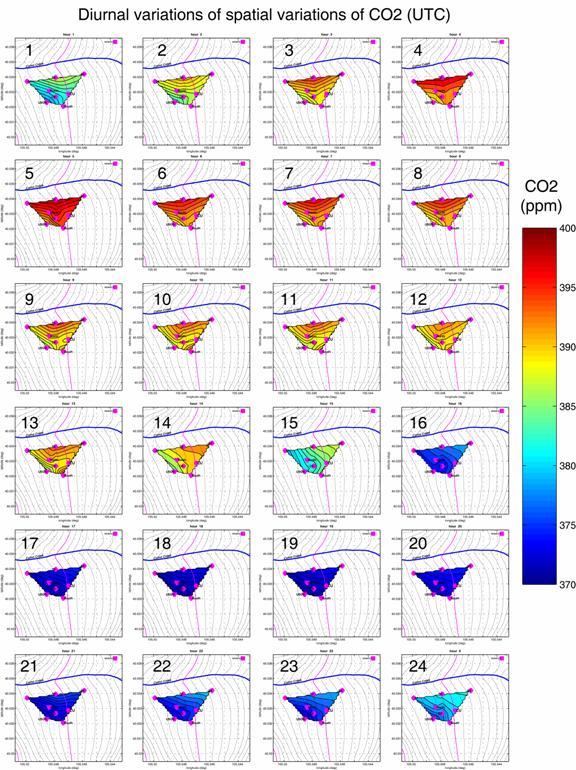
BGS Figure1: Diurnal variation of spatial distribution of CO2 at the Niwot-Ridge AmeriFlux tower site during September, 2002. The number that is in each plot represents hours in universal time coordinates (UTC.)
Identifying the sources, transport and sinks of mineral aerosols using NCAR models and available observations have been the focus of substantial work for Natalie Mahowald in CGD, especially with regard to how humans may modulate this ‘natural’ aerosol. Model simulations of dust for many years using NCEP reanalysis datasets showed that dust climatologies using NCAR models are good (in collaboration with Chao Luo at UCSB), although this work also showed that dust sensitivity to meteorology and source parameterization are larger than the differences between including and excluding a landuse source in the model. Further work with Masaru Yoshioka (graduate student at UCSB) suggests that even the TOMS AI, which has been used to argue that mineral aerosols have a largely natural source, is unable to distinguish between land use and natural sources included in the model. Collaboration with Jean-Louis Dufrense (UCSB and LMD in France) have suggested that TOMS AI sensitivities to PBLH may be responsible for some of the previous results identifying natural dry lake beds as the major sources of dust. This is due to the sensitivity of TOMS AI to aerosols which are higher in the atmosphere, and the fact that natural dry lake beds in the middle of desert regions tend to have higher boundary layer heights than marginal areas on the edges of deserts, where land use is likely. Collaborations with Rob Bryant (University of Sheffield) showed that hydrology in dry lake basins in Africa plays a complicating role in modulating dust emissions, and imply that human extraction of water from dry lake bed systems may also have a role in causing mineral aerosol source regions. The source of the temporal variability in mineral aerosols has been addressed by studies in collaboration with Charles Jones (UCSB) and Chao Luo (UCSB), in which we have quantified the role of African easterly waves and diurnal variability in driving mineral aerosol variability. Aerosol assimilation efforts by Phil Rasch (CMS) and Bill Collins (CMS) use the mineral aerosol model developed by Charlie Zender (UCI) and Mahowald.
Using six different scenarios, Mahowald in collaboration with Chao Luo (UCSB) has made the first estimates of future and preindustrial dust sources using CSM simulations. These simulations suggest that mineral aerosols may decrease by 20-60% in the future, a result which depends on the model simulation used for the calculation. An important point from these simulations is that ‘natural’ aerosols such as mineral aerosols are very sensitive to human impacts on carbon dioxide, land use and climate change, and because of the important role of mineral aerosols in modulating climate and biogeochemistry, may cause important feedbacks.
Efforts have also been directed at understanding the role of mineral aerosols on impacting climate and biogeochemistry. Mahowald and Lisa Kiehl (graduate student at UCSB) showed that mineral aerosols may interact with clouds in North Africa and North Atlantic in both the liquid and ice phase, suggesting for the first time large scale interactions between mineral aerosols and clouds. Mahowald with Greg Okin (University of Virginia) and others have shown that mineral aerosol inputs to ecosystems such as the Amazon play an important role in supplying nutrients. Mahowald and Jenny Hand (ASP postdoc) have investigated the changes to iron solubility which occur while mineral aerosols are transported in the atmosphere due to clouds and solar radiation in collaboration with observationalists Ron Siefert and Yin Chen (University of Maryland). Work with Claire Mahaffrey and Ric Williams (University of Liverpool) has shown the role of mineral aerosols in supplying iron for nitrogen fixation in the North Atlantic during field campaigns, while work with Dave Siegel and others at UCSB have looked at the role globally of mineral aerosols in fertilizing ocean biota using satellite data.
In collaboration with Sam Levis (TSS), Phil Rasch (CMS) and Charlie Zender (UCI), interactive dust has been put into the latest version of the CAM model. This dust will enable us to examine in more detail the interactions between climate and biogeochemistry in the CCSM framework.
Other topics:
Efforts are underway to incorporate water and carbon isotopes into the CCSM framework, organized by Mahowald and Andrew Gettelman (CMS). An organizational meeting took place during the June 2003 CCSM workshop, and a scientific workshop has been proposed to better facilitate this effort in January 2004.
Research and Instrument Developments: ATD and ACD
These efforts were co-sponsored by the NCAR Airborne In Situ Chemical Sensor group and BGS.
An instrument was designed and constructed which will allow measurement of CO2 mixing ratios or fluxes. The design represents a novel approach to data acquisition and processing which is expected to improve instrument noise specifications to meet or exceed present state-of-the-art. Initial flight tests were conducted as part of the IDEAS-3 test program in September 2003. Preliminary assessments give hope that airborne flux measurements may be possible with small or no artifact produced from interaction between the sensor components and aircraft motion. The instrument hardware and processing software will be refined in FY04 to provide further precision improvements for both mixing ratio and flux measurement modes.
A new design was developed to modify our commercial vacuum ultraviolet resonance fluorescence carbon monoxide instrument for more reliable operation and ease of field deployment. The existing instrument has been successfully deployed on several airborne missions. Most recently the instrument underwent a successful laboratory intercalibration exercise in April, 2003, as part of the CRYSTAL-FACE experiment. Collaborators included Teresa Campos (ATD), and Max Loewenstein, Jimena Lopez, and Hans-Jurg Jost (all from NASA-Ames). A proposal was submitted during the summer of 2003 by Ian Faloona (UC-Davis) to collaboratively explore the potential for improvement of the sensor’s time response. If funding is awarded, improvements will be implemented in FY2004 to attempt eddy correlation measurement of CO fluxes.
Miniaturized gas modules were developed and constructed to allow significant weight and size reduction of support and calibration gases used in both CO2 and CO instruments. This approach will also allow standard gas calibration under controlled laboratory conditions.
The RAF Oxygen Analyzer (ROXAN) was adapted and tested for airborne oxygen measurements during the IDEAS II campaign. The cause of a persistent motion-sensitivity was identified and resolved, resulting in a precision comparable to or better than existing ground-based techniques. This instrument is currently being repackaged by ATD-BGSI for future laboratory and field studies relating to the global carbon cycle.
A modified commercial fuel-cell O2 analyzer has been operating semi-continuously at a tall tower research site in Northern Wisconsin since June of 2000, in collaboration with NOAA, USFS, and Penn State scientists. In the past year, several field visits were made to repair and upgrade the instrumentation. Results are currently being prepared for publications on the measurement technique, and on applications in plant physiology, forest ecology, industrial emission verification, and continental boundary-layer mixing.
In collaboration with NOAA CMDL and Scripps Institution of Oceanography, ATD-BGSI is working to establish internal calibration scales for CO2 and O2 that will be used to support a wide range of NCAR studies. This facility will include a suite of 6 primary reference cylinders with an expected lifetime greater than 20 years and capabilities for filling, spiking, and calibrating secondary cylinders.
ATD-BGSI scientists participated in this study during June, investigating regional CO2 fluxes across North America. The University of North Dakota Citation was based at RAF for instrument integration and staging during the month-long campaign. The NCAR Multiple Enclosure Device for Unfractionated Sampling of Air (MEDUSA) was used to collect over 400 discrete samples, which are being analyzed for CO2, CH4, N2O, H2, and SF6 concentrations, and 13C in CO2, 18O in CO2, 13C in CH4, O2/N2, and Ar/N2 ratios. Collaborators in this study include Harvard University, NOAA CMDL, and University of North Dakota.
As part of the 2002 Niwot Ridge Pilot Experiment, ISFF data were analyzed and synthesized with observations from other groups. In collaboration with CU, the HYDRA CO2 measurement system is being redeployed for an undersnow CO2 experiment this winter.
The Carbon in the Mountains Experiment (CME), a BGSI proposal to NSF Biocomplexity involving ATD, CGD, MMM, and CU researchers, was funded at a level of $2M over 5 years. This study will involve the deployment of 9 independent CO2 systems at the Niwot Ridge site and interpretation of their measurements using a high-resolution data-assimilation model to examine carbon exchange in complex environments. In FY03, several robust inexpensive CO2 analyzers were tested and a prototype CO2 measurements system is now being assembled. This work will benefit from advances in communications, power, meteorological observations, and network deployments being made in the Intelligent Sensor Array Initiative.
ATD scientists have assembled and tested a prototype of the TRAM system, which features sensor packages which move along a cable supported by towers. This approach allows the spatial variation of a variety of atmospheric quantities at small scales, such as those within a forest canopy, to be sampled. Improvements to the system are planned based upon the test results.
ACD wildland fire activities are advancing our understanding of the role of fires in atmospheric chemistry and regional air quality. This is being accomplished through multidisciplinary laboratory and modeling studies of the controlling processes on various scales. ACD participants in these activities include James Greenberg, Alex Guenther, Peter Harley, Peter Hess, Thomas Karl, Sreela Nandi, and Christine Wiedinmyer.
Significant accomplishments for FY03 include observations of oxygenated VOC emissions from heated vegetation and the development of regional initiatives in North America and Brazil.
For more information on wildfires go to: http://www.rap.ucar.edu/asr2003/
ACD scientists (Greenberg, Karl, Harley, and Guenther) are exposing vegetation to different conditions representative of fires in order to quantify emissions of VOC and other trace gases. This is in order to determine if they are important energy and mass inputs to wildfires by controlling the spatial and temporal evolution of the gaseous fuels’ influences on fire dynamics and ignitability of the vegetation. The results indicate that these VOC do have a role in fire dynamics and ignitability. Future efforts will incorporate the results into models to improve predictions of fire dynamics and inputs to air quality models.
ACD scientists (Guenther, Hess, Karl, Nandi, and Wiedinmyer) are developing modeling tools and plans for regional investigations of the impact of fires on regional air quality. Modeling simulations of the Amazon basin have been initiated by Nandi and Wiedinmyer using MM5 and the Community Model for Air Quality (CMAQ). The goals of this Amazon modeling effort include analysis of the 2002 Smoke Aerosols, Clouds, Rainfall and Climate (SMOCC) study observations and preparation for the 2004 Chemistry and Production Of Smoke (CAPOS) study. Efforts have also been initiated to characterize North American fire emissions (Wiedinmyer) and develop a real time air quality forecasting model based on WRF-Chem (Hess).
Whole Atmosphere Community Climate Model (WACCM)
The Whole Atmosphere Community Climate Model (WACCM) Group includes Rolando Garcia, Doug Kinnison, Daniel Marsh, Stacy Walters; with Byron Boville and Fabrizio Sassi (CGD), and Raymond Roble, Benjamin Foster, and Qian Wu (HAO).
Version 1b of the model (WACCM1b) was completed and “frozen”. This is a non-interactive version of WACCM, whose dynamical outputs can be used to drive the MOZART-3 offline chemical model. Documentation and code for WACCM1b has been made available to the university community through the WACCM web site (http://acd.ucar.edu/models/WACCM/); code and selected output datasets are available through the Community Data Portal (https://dataportal.ucar.edu).
We are currently testing version 2 of WACCM (WACCM2), a fully-interactive model than incorporates the MOZART-3 chemistry mechanism, NLTE longwave parameterization, shortwave heating shortward of 200 nm, full accounting of chemical potential heating and airglow losses, and an auroral parameterization (for heating and NOx production). The model will be used to investigate problems where coupling between chemistry and dynamics is important, e.g., the response of the winter stratosphere to ozone depletion, the effect of increasing greenhouse gases, and the response to solar variability over the 11-year solar cycle.